Phobos 2.0 Quickstart Tutorial
This tutorial will help you understand how to configure and install Phobos inside an Akka.NET v1.4+ application.
Note
For this quickstart tutorial, we're going to clone the Petabridge.Phobos.Web repository from Github and run it.
This project is a ready-made solution for testing Phobos in a real production environment using the following technologies:
- .NET 7.0
- ASP.NET Core 7.0
- Akka.Cluster
- Prometheus
- Jaeger Tracing
- Grafana
- Docker
- and finally, Kubernetes
Video Overview
If you want to get a gist of how the installation process works, you can follow the video from our Phobos Installation Tutorial below.
For further reading, please also see "Phobos Configuration".
Note
The Phobos QuickStart Tutorial also uses the "Phobos + Prometheus Akka.Cluster Dashboard for Grafana," which can immediately visualize your Phobos data inside Grafana when you're using Prometheus (which this demo does.) You should check it out along with the other Phobos dashboards.
Build and Local Deployment
Start by cloning this repository to your local system.
Next - to build this solution you will need to purchase a Phobos license key. They cost $4,000 per year per organization with no node count or seat limitations and comes with a 30 day money-back guarantee.
Once you purchase a Phobos NuGet keys for your organization, you're going to want to open NuGet.config
and add your key:
<?xml version="1.0" encoding="utf-8"?>
<configuration>
<solution>
<add key="disableSourceControlIntegration" value="true" />
</solution>
<packageSources>
<clear />
<add key="nuget.org" value="https://api.nuget.org/v3/index.json" />
<add key="phobos" value="{your key here}" />
</packageSources>
</configuration>
From there, run the following command on the prompt:
PS> .\build.cmd Docker
This will create the Docker images the solution needs to run inside Kubernetes: petabridge.phobos.web:0.1.0
.
Deploying the K8s Cluster (with Telemetry Installed)
From there, everything you need to run the solution in Kubernetes is already defined inside the k8s/
- just run the following command to launch the Phobos-enabled application inside Kubernetes:
PS> .\k8s\deployAll.cmd
This will spin up a separate Kubernetes namespace, phobos-web
, and you can view which services are deployed by running the following command:
PS> kubectl get all -n phobos-web
You should see the following or similar output:
NAME READY STATUS RESTARTS AGE
pod/grafana-5f54fd5bf4-wvdgw 1/1 Running 0 11m
pod/jaeger-578558d6f9-2xzdv 1/1 Running 0 11m
pod/phobos-web-0 1/1 Running 3 11m
pod/phobos-web-1 1/1 Running 2 10m
pod/phobos-web-2 1/1 Running 0 9m54s
pod/prometheus-deployment-c6d99b8b9-28tmq 1/1 Running 0 11m
NAME TYPE CLUSTER-IP EXTERNAL-IP PORT(S) AGE
service/grafana-ip-service LoadBalancer 10.105.46.6 localhost 3000:31641/TCP 11m
service/jaeger-agent ClusterIP None <none> 5775/UDP,6831/UDP,6832/UDP,5778/TCP 11m
service/jaeger-collector ClusterIP 10.109.248.20 <none> 14267/TCP,14268/TCP,9411/TCP 11m
service/jaeger-query LoadBalancer 10.109.204.203 localhost 16686:30911/TCP 11m
service/phobos-web ClusterIP None <none> 4055/TCP 11m
service/phobos-webapi LoadBalancer 10.103.247.68 localhost 1880:30424/TCP 11m
service/prometheus-ip-service LoadBalancer 10.101.119.120 localhost 9090:31698/TCP 11m
service/zipkin ClusterIP None <none> 9411/TCP 11m
NAME READY UP-TO-DATE AVAILABLE AGE
deployment.apps/grafana 1/1 1 1 11m
deployment.apps/jaeger 1/1 1 1 11m
deployment.apps/prometheus-deployment 1/1 1 1 11m
NAME DESIRED CURRENT READY AGE
replicaset.apps/grafana-5f54fd5bf4 1 1 1 11m
replicaset.apps/jaeger-578558d6f9 1 1 1 11m
replicaset.apps/prometheus-deployment-c6d99b8b9 1 1 1 11m
Note
The restarts from the phobos-web-*
pods come from calling Dns.GetHostName()
prior to the local K8s service allocating its hostnames. Nothing to worry about - it'll resolve itself in a few moments.
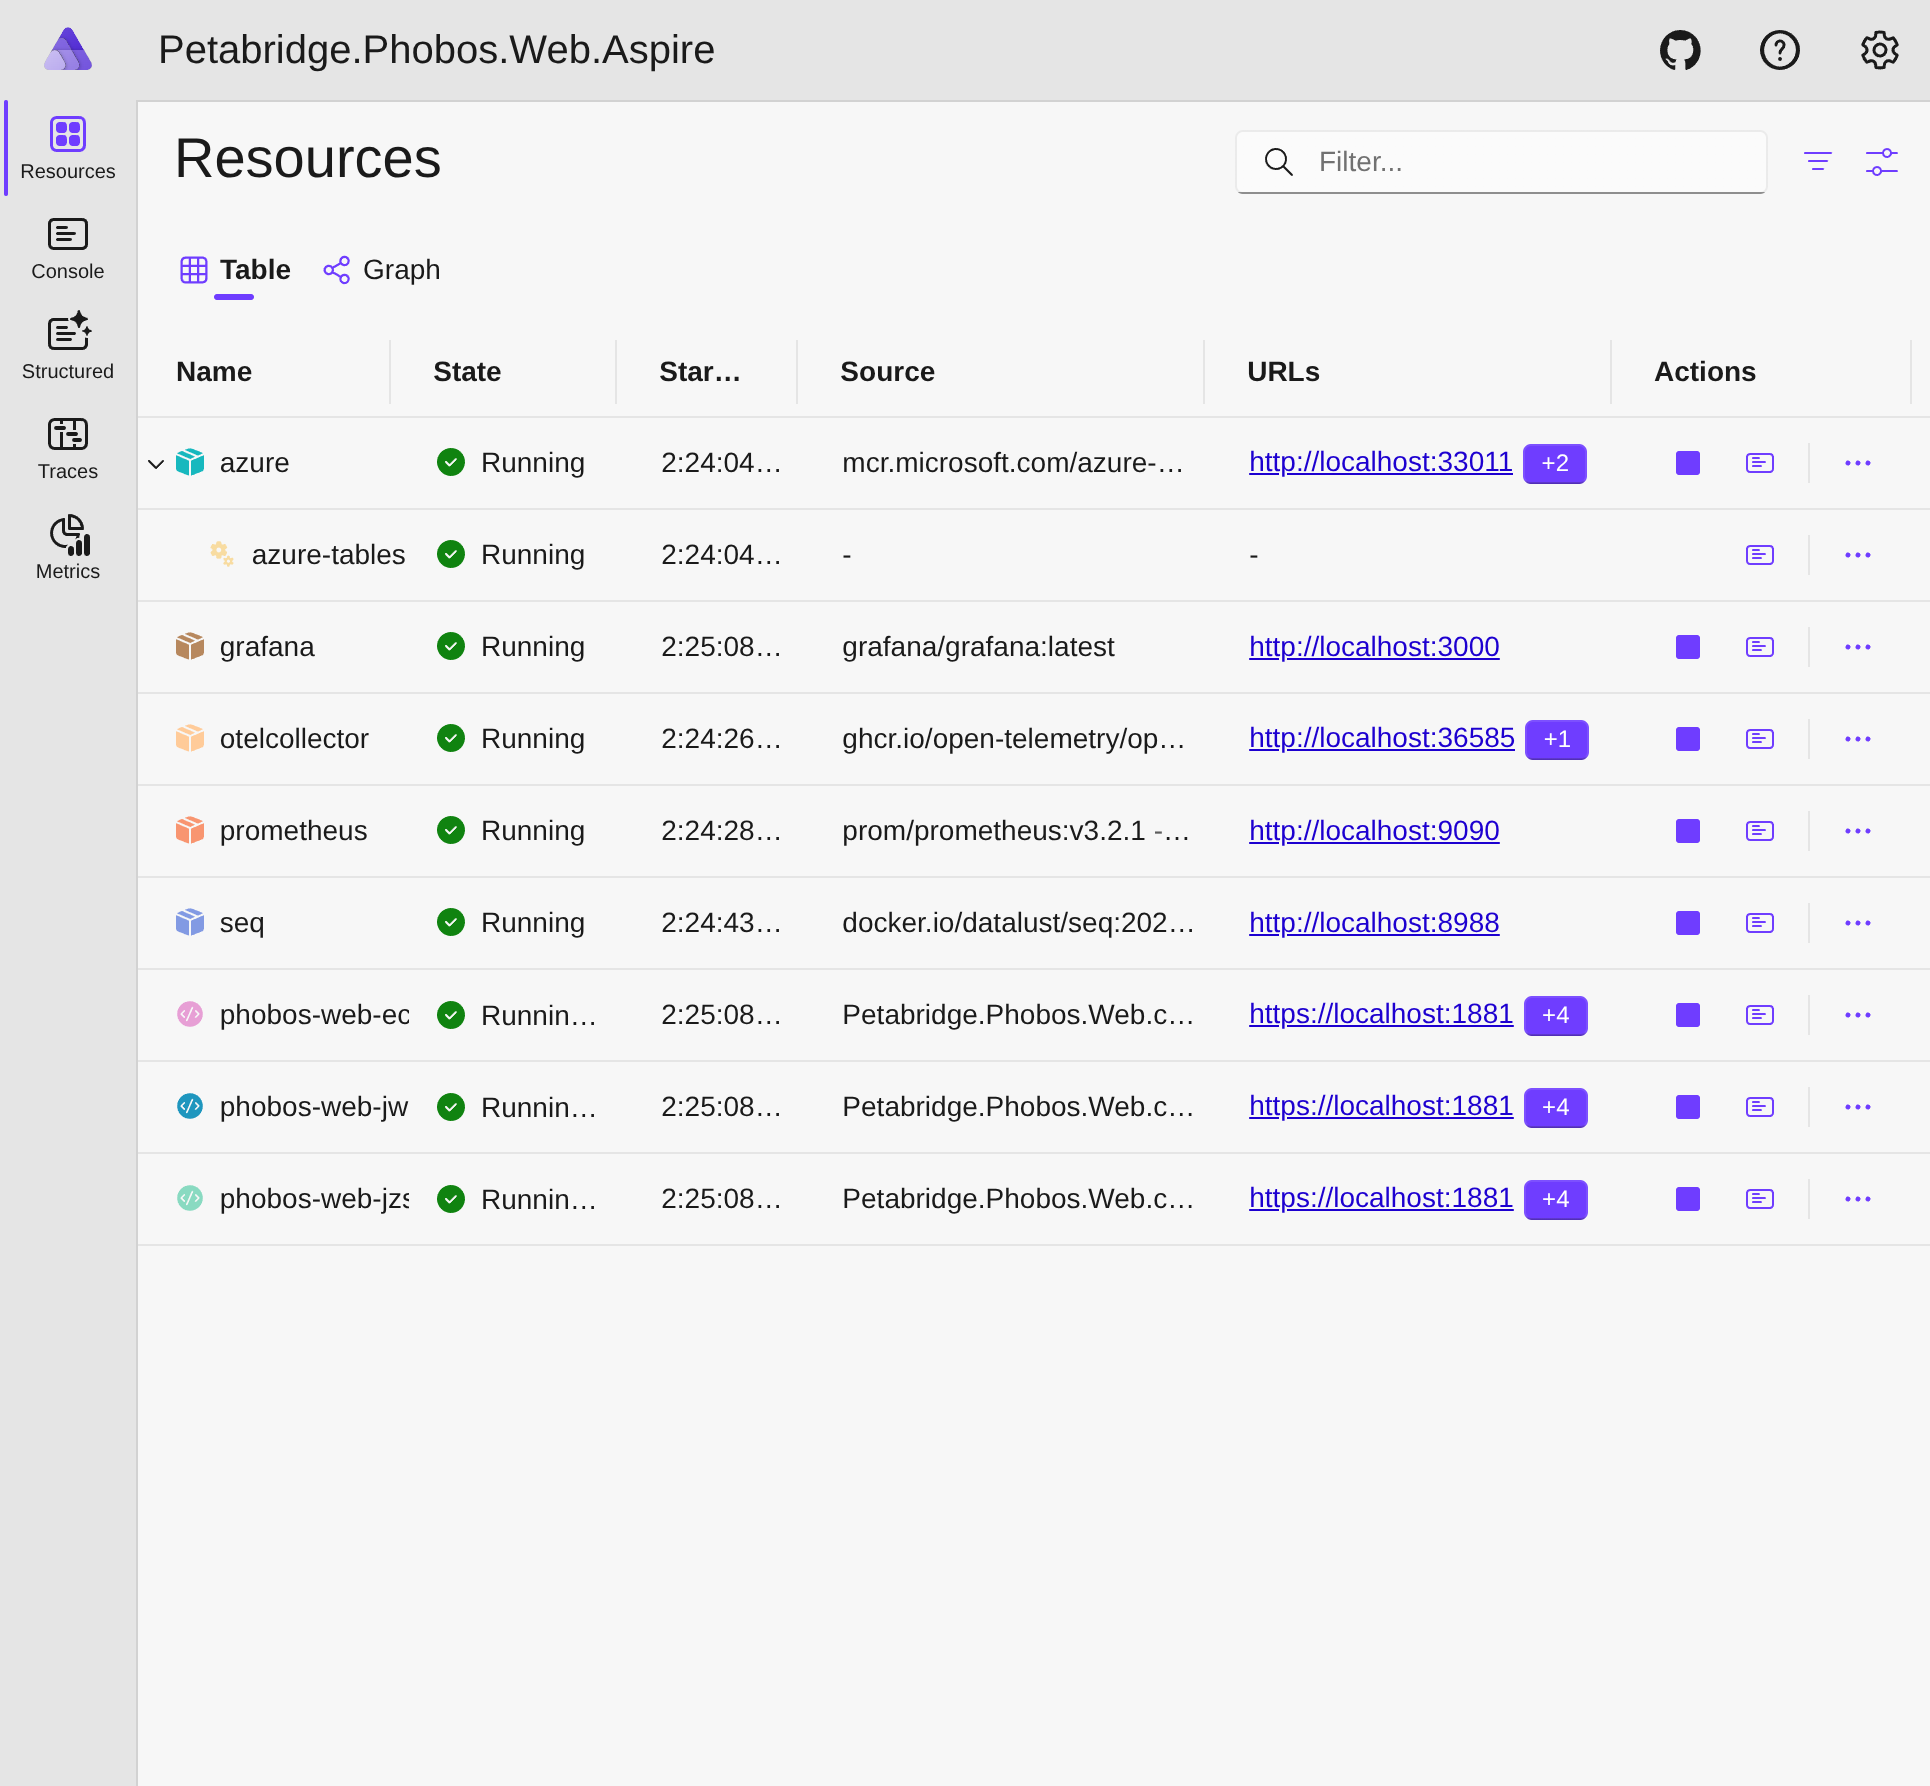
Once the cluster is fully up and running you can explore the application and its associated telemetry via the following Urls:
- http://localhost:1880 - generates traffic across the Akka.NET cluster inside the
phobos-web
service. - http://localhost:16686/ - Jaeger tracing UI. Allows to explore the traces that are distributed across the different nodes in the cluster.
- http://localhost:9090/ - Prometheus query UI.
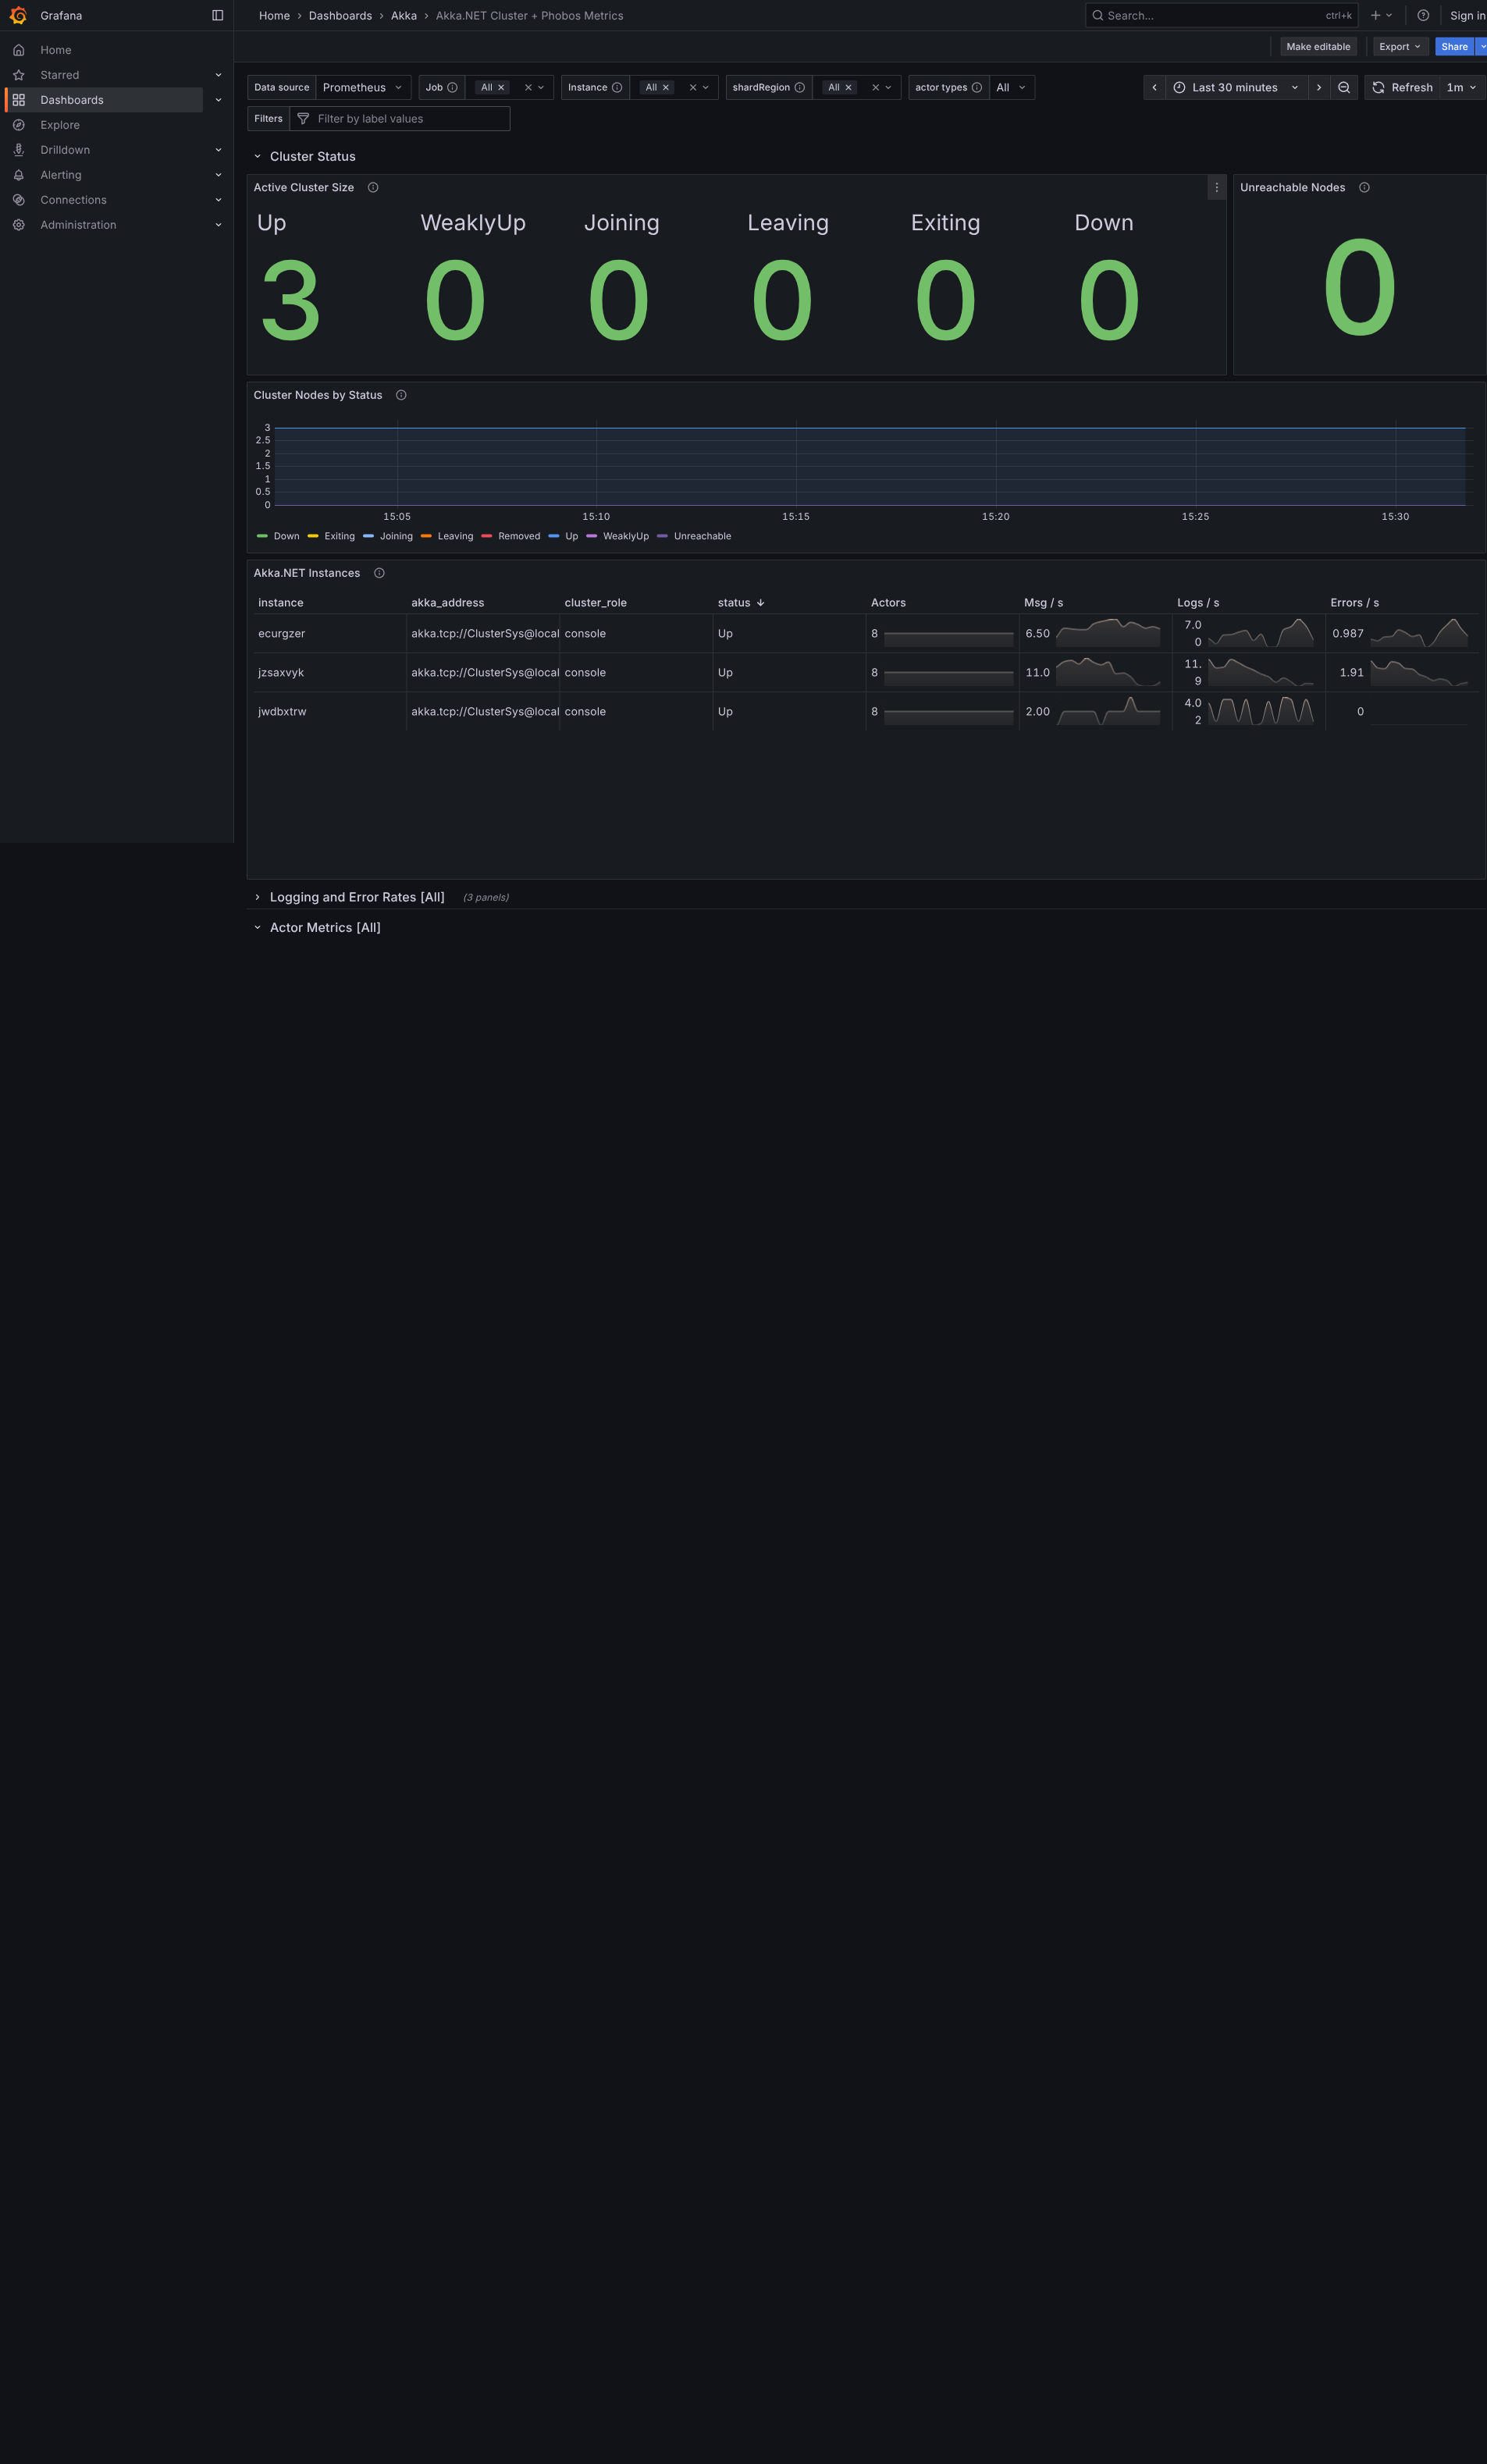
- http://localhost:3000/ - Grafana metrics. Log in using the username admin and the password admin. It includes some ready-made
dashboards you can use to explore Phobos + App.Metrics metrics:
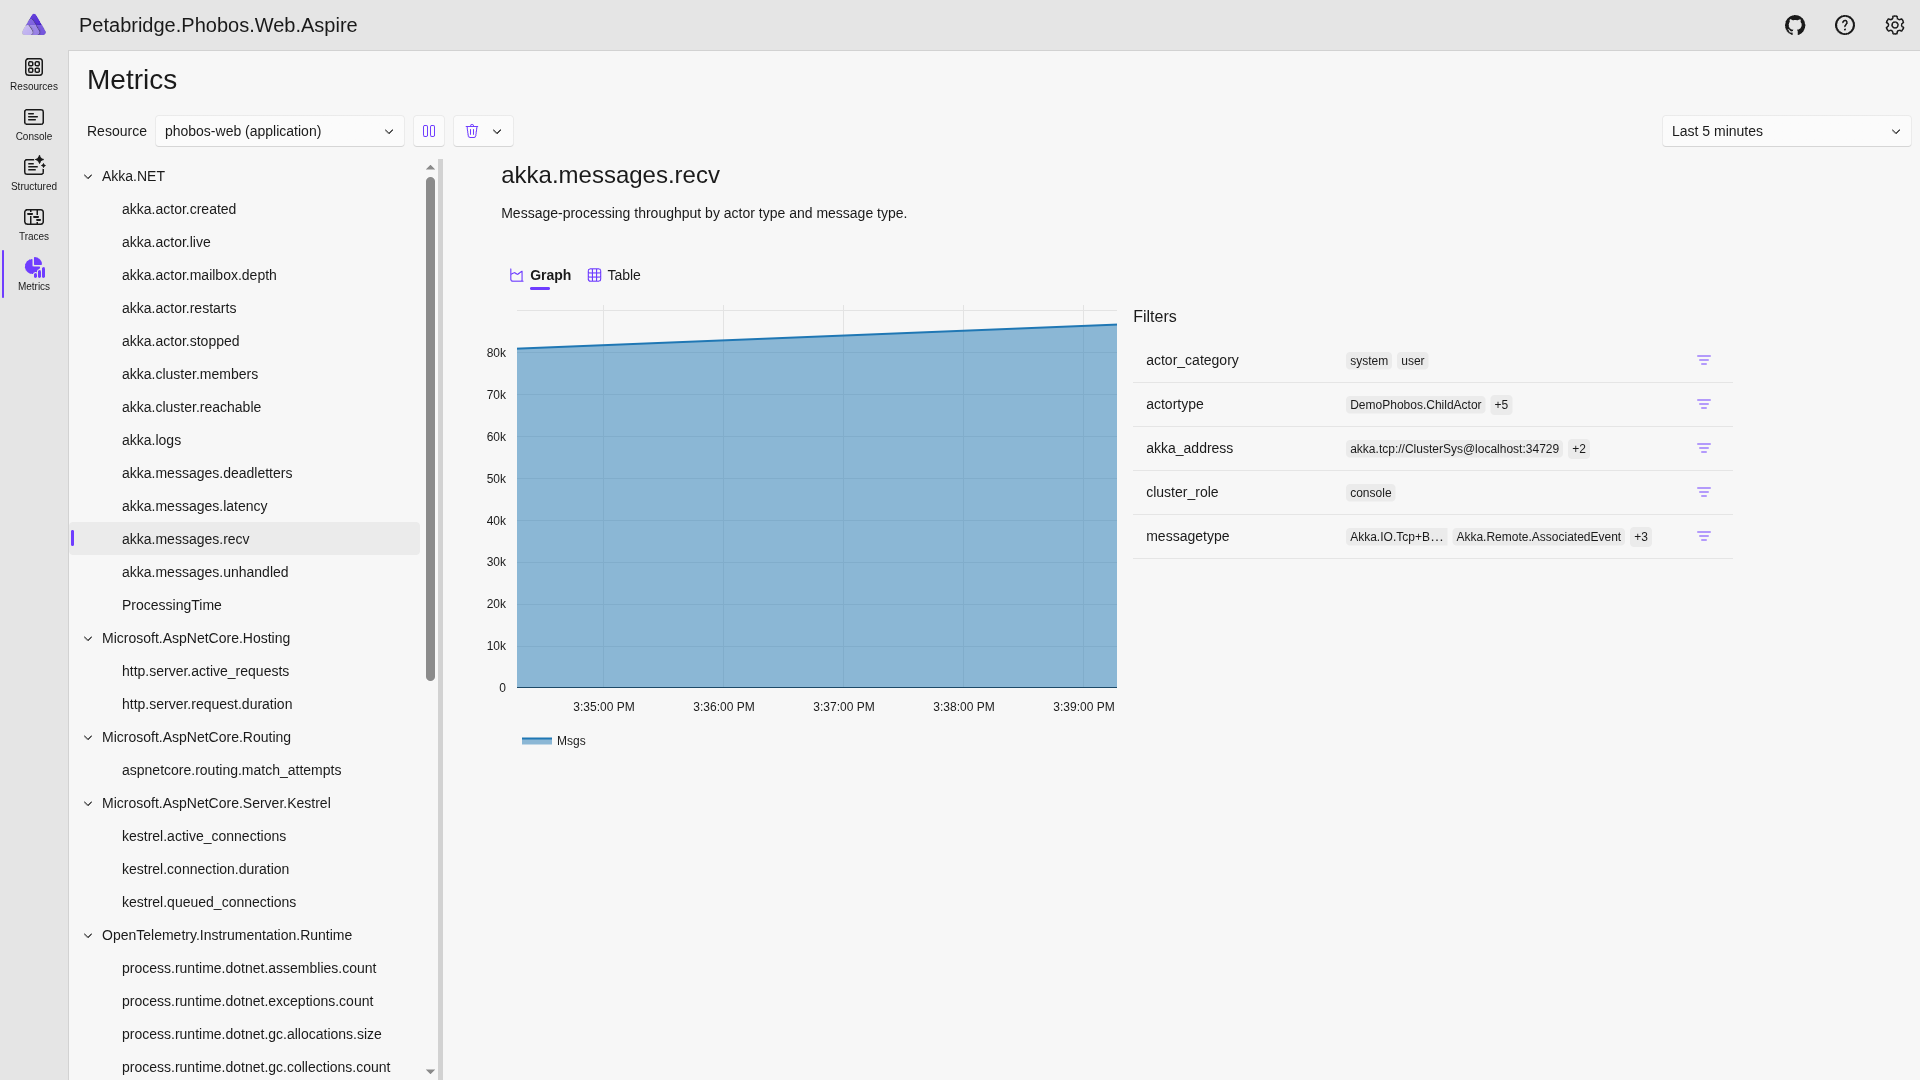
There's many more metrics exported by Phobos that you can use to create your own dashboards or extend the existing ones - you can view all of them by going to http://localhost:1880/metrics
Looking at the Code
So we can poke around and play with the solution now, but where's the real code?
It's all located inside the Startup.cs
class.
public class Startup
{
// OpenTelemetry.Exporter.OpenTelemetryProtocol exporter supports several environment variables
// that can be used to configure the exporter instance:
//
// * OTEL_EXPORTER_OTLP_ENDPOINT
// * OTEL_EXPORTER_OTLP_HEADERS
// * OTEL_EXPORTER_OTLP_TIMEOUT
// * OTEL_EXPORTER_OTLP_PROTOCOL
//
// Please read https://opentelemetry.io/docs/concepts/sdk-configuration/otlp-exporter-configuration/
// for further information.
//
// Note that OTEL_EXPORTER_OTLP_PROTOCOL only supports "grpc" and "http/protobuf"
// This method gets called by the runtime. Use this method to add services to the container.
// For more information on how to configure your application, visit https://go.microsoft.com/fwlink/?LinkID=398940
public void ConfigureServices(IServiceCollection services)
{
// Prometheus exporter won't work without this
services.AddControllers();
var resource = ResourceBuilder.CreateDefault()
.AddService(Assembly.GetEntryAssembly().GetName().Name, serviceInstanceId: $"{Dns.GetHostName()}");
// enables OpenTelemetry for ASP.NET / .NET Core
services.AddOpenTelemetry()
.WithTracing(builder =>
{
builder
.SetResourceBuilder(resource)
.AddPhobosInstrumentation()
.AddSource("Petabridge.Phobos.Web")
.AddHttpClientInstrumentation(options =>
{
// don't trace HTTP output to Seq
options.FilterHttpRequestMessage = httpRequestMessage => !httpRequestMessage.RequestUri?.Host.Contains("seq") ?? false;
})
.AddAspNetCoreInstrumentation(options =>
{
options.Filter = context => !context.Request.Path.StartsWithSegments("/metrics");
})
.AddOtlpExporter();
})
.WithMetrics(builder =>
{
builder
.SetResourceBuilder(resource)
.AddPhobosInstrumentation()
.AddHttpClientInstrumentation()
.AddAspNetCoreInstrumentation()
.AddPrometheusExporter(_ => { });
});
// sets up Akka.NET
ConfigureAkka(services);
}
public static void ConfigureAkka(IServiceCollection services)
{
services.AddAkka("ClusterSys", (builder, provider) =>
{
// use our legacy app.conf file
var config = ConfigurationFactory.ParseString(File.ReadAllText("app.conf"))
.BootstrapFromDocker()
.UseSerilog();
builder.AddHocon(config)
.WithClustering(new ClusterOptions { Roles = new[] { "console" } })
.WithPhobos(AkkaRunMode.AkkaCluster) // enable Phobos
.StartActors((system, registry) =>
{
var consoleActor = system.ActorOf(Props.Create(() => new ConsoleActor()), "console");
var routerActor = system.ActorOf(Props.Empty.WithRouter(FromConfig.Instance), "echo");
var routerForwarderActor =
system.ActorOf(Props.Create(() => new RouterForwarderActor(routerActor)), "fwd");
registry.TryRegister<RouterForwarderActor>(routerForwarderActor);
})
.StartActors((system, registry) =>
{
// start https://cmd.petabridge.com/ for diagnostics and profit
var pbm = PetabridgeCmd.Get(system); // start Pbm
pbm.RegisterCommandPalette(ClusterCommands.Instance);
pbm.RegisterCommandPalette(new RemoteCommands());
pbm.Start(); // begin listening for PBM management commands
});
});
}
// This method gets called by the runtime. Use this method to configure the HTTP request pipeline.
public void Configure(IApplicationBuilder app, IWebHostEnvironment env)
{
if (env.IsDevelopment()) app.UseDeveloperExceptionPage();
// per https://github.com/open-telemetry/opentelemetry-dotnet/blob/main/src/OpenTelemetry.Exporter.Prometheus/README.md
app.UseRouting();
app.UseOpenTelemetryPrometheusScrapingEndpoint();
app.UseEndpoints(endpoints => { endpoints.MapControllers(); });
app.UseEndpoints(endpoints =>
{
var tracer = endpoints.ServiceProvider.GetService<TracerProvider>().GetTracer("Petabridge.Phobos.Web");
var actors = endpoints.ServiceProvider.GetService<ActorRegistry>();
endpoints.MapGet("/", async context =>
{
// fetch actor references from the registry
var routerForwarderActor = actors.Get<RouterForwarderActor>();
using (var s = tracer.StartActiveSpan("Cluster.Ask"))
{
// router actor will deliver message randomly to someone in cluster
var resp = await routerForwarderActor.Ask<string>($"hit from {context.TraceIdentifier}",
TimeSpan.FromSeconds(5));
await context.Response.WriteAsync(resp);
}
});
});
}
}
This is the entire configuration using OpenTelemetry, Phobos, and Akka.Hosting.
Installing OpenTelemetry Exporters and Instrumentation
In order to receive any kind of data from our application we need to install the base OpenTelemetry NuGet packages for .NET, including:
OpenTelemetry.Extensions.Hosting
- includes the base APIs andIServiceCollection
extension methods;OpenTelemetry.Instrumentation.AspNetCore
- all ASP.NET Core OTel instrumentation;OpenTelemetry.Instrumentation.Http
- allHttpClient
OTel instrumentation;OpenTelemetry.Exporter.OpenTelemetryProtocol
- enables OTel traces to be exported to Jaeger; andOpenTelemetry.Exporter.Prometheus.AspNetCore
- which enables OTel metrics to be exported to Prometheus (requires ASP.NET orHttpListener
to expose the/metrics
HTTP route.)
With these packages installed, we first create a Resource
using the OpenTelemetry SDK:
var resource = ResourceBuilder.CreateDefault()
.AddService(Assembly.GetEntryAssembly().GetName().Name, serviceInstanceId: $"{Dns.GetHostName()}");
This Resource
is going to be what provides all of the service / instanceId / appVersion data to the OpenTelemetry-enabled tracing and metrics services you export your data to - so it's important to spell this out before you start configuring your tracing and metrics export pipelines.
Next, we add some calls to the IServiceCollection
to configure our OpenTelemetry TracerProviderBuilder
:
// enables OpenTelemetry for ASP.NET / .NET Core
services.AddOpenTelemetry()
.WithTracing(builder =>
{
builder
.SetResourceBuilder(resource)
.AddPhobosInstrumentation() // extension method provided by Phobos
.AddSource("Petabridge.Phobos.Web")
.AddHttpClientInstrumentation(options =>
{
// don't trace HTTP output to Seq
options.FilterHttpRequestMessage = httpRequestMessage => !httpRequestMessage.RequestUri?.Host.Contains("seq") ?? false;
})
.AddAspNetCoreInstrumentation(options =>
{
options.Filter = context => !context.Request.Path.StartsWithSegments("/metrics");
})
.AddOtlpExporter();
});
The builder.AddPhobosInstrumentation()
call causes the TracerProvider
, which is configured to export its traces to Phobos, to also include traces that originate from the Phobos library running inside your ActorSystem
.
The configuration of the OpenTelemetry MeterProviderBuilder
is nearly identical to the tracing configuration:
services.AddOpenTelemetry()
.WithMetrics(builder =>
{
builder
.SetResourceBuilder(resource)
.AddPhobosInstrumentation()
.AddHttpClientInstrumentation()
.AddAspNetCoreInstrumentation()
.AddPrometheusExporter(_ => { });
});
If you query the /metrics
route of your HTTP application you should see a set of Prometheus text format metrics appear once the application has started.
Configuring Phobos and Starting the ActorSystem
Now that we've configured our OpenTelemetry metrics and tracing, the next thing we need to do is configure our ActorSystem
to start Phobos!
By default this sample uses Phobos.Hosting
, which makes the process of configuring Akka.NET to use Phobos a literal 1-line install:
public static void ConfigureAkka(IServiceCollection services)
{
services.AddAkka("ClusterSys", (builder, provider) =>
{
// use our legacy app.conf file
var config = ConfigurationFactory.ParseString(File.ReadAllText("app.conf"))
.BootstrapFromDocker()
.UseSerilog();
builder.AddHocon(config)
.WithClustering(new ClusterOptions { Roles = new[] { "console" } })
.WithPhobos(AkkaRunMode.AkkaCluster) // enable Phobos
.StartActors((system, registry) =>
{
var consoleActor = system.ActorOf(Props.Create(() => new ConsoleActor()), "console");
var routerActor = system.ActorOf(Props.Empty.WithRouter(FromConfig.Instance), "echo");
var routerForwarderActor =
system.ActorOf(Props.Create(() => new RouterForwarderActor(routerActor)), "fwd");
registry.TryRegister<RouterForwarderActor>(routerForwarderActor);
})
.StartActors((system, registry) =>
{
// start https://cmd.petabridge.com/ for diagnostics and profit
var pbm = PetabridgeCmd.Get(system); // start Pbm
pbm.RegisterCommandPalette(ClusterCommands.Instance);
pbm.RegisterCommandPalette(new RemoteCommands());
pbm.Start(); // begin listening for PBM management commands
});
});
}
Only the .WithPhobos(AkkaRunMode.AkkaCluster)
is needed to install Phobos in this scenario.
Tip
If you haven't upgraded to using Akka.Hosting inside your Akka.NET applications, you really should as it's a best practice. However, if you'd prefer to install Phobos without Akka.Hosting you can follow the instructions here: "Configuring Phobos - Classic Phobos Installation."
That's all we need to capture the automatically collected Phobos data, but if we want to manually capture data there's more we can do below.
Calling Phobos APIs
If you want to call the Phobos APIs directly to capture additional data, this is something you can do by calling Context.GetInstrumentation()
inside any actor:
public sealed class ConsoleActor : ReceiveActor
{
private readonly ILoggingAdapter _log = Context.GetLogger(SerilogLogMessageFormatter.Instance);
public ConsoleActor()
{
var processingTimer = Context.GetInstrumentation().Monitor.CreateHistogram<double>("ProcessingTime", "ms");
Receive<string>(_ =>
{
// use the local metrics handle to record a timer duration for how long this block of code takes to execute
var start = DateTime.UtcNow;
// start another span programmatically inside actor
using (var newSpan = Context.GetInstrumentation().Tracer.StartActiveSpan("SecondOp"))
{
var child = Context.ActorOf(Props.Create(() => new ChildActor()));
_log.Info("Spawned {child}", child);
child.Forward(_);
}
var duration = (DateTime.UtcNow - start).TotalMilliseconds;
processingTimer.Record(duration);
});
}
}
When we call Context.GetInstrumentation().Monitor
, we are accessing the Meter
instance used by the application - and we can create custom metrics, such as a Histogram<double>
in this case - and these will all be picked up by Prometheus automatically.
Alternatively, when we call Context.GetInstrumentation().Tracer.StartActiveSpan("SecondOp")
- this is creating a new span operation that is a child span of the current one the actor created when it began processing the message, and logs that are recorded inside that using
block will automatically be appended to the currently active TelemetrySpan
.
Tearing Down the Cluster
When you're done exploring this sample, you can tear down the cluster by running the following command:
PS> .\k8s\destroyAll.cmd
This will delete the phobos-web
namespace and all of the resources inside it.
Further Reading
For further reading, please see: