Automatically Captured Data
Phobos attempts to capture as much data as is relevant automatically, without the need for explicit instrumentation code inside your Akka.NET applications and most importantly: Phobos is designed to automatically connect the dots between Akka.NET and other parts of your application, like HttpClient, ASP.NET, ADO.NET, and more.
Overview: Quick Reference
Tip
Understanding Phobos Metrics
Phobos automatically captures comprehensive telemetry data across three main categories:
- Traces: Distributed traces showing message flow through your actor system
- Metrics: Counters, gauges, and histograms tracking system performance
- Logs: Structured logging integrated with trace context
Key Metrics at a Glance
| Category | Metric | Type | Description | Critical for |
|---|---|---|---|---|
| Messages | akka.messages.recv |
Counter | Messages processed per actor/message type | Throughput monitoring |
| Latency | akka.messages.latency |
Histogram | End-to-end message processing time | Performance analysis |
| Mailbox | akka.actor.mailbox.depth |
Gauge | Actor mailbox queue depth | Backpressure detection |
| Actors | akka.actor.live |
Gauge | Current number of live actors | System health |
| Errors | akka.actor.restarts |
Counter | Actor restart frequency | Stability monitoring |
| Cluster | akka.cluster.members |
Gauge | Cluster member count by status | Cluster health |
| Sharding | akka.cluster.sharding.entities |
Gauge | Entity distribution across nodes | Shard balance |
Note
To see exactly what data Phobos captures in action, check out our quickstart guide.
Trace Data
Trace data in Phobos is generated automatically whenever an actor processes a message:
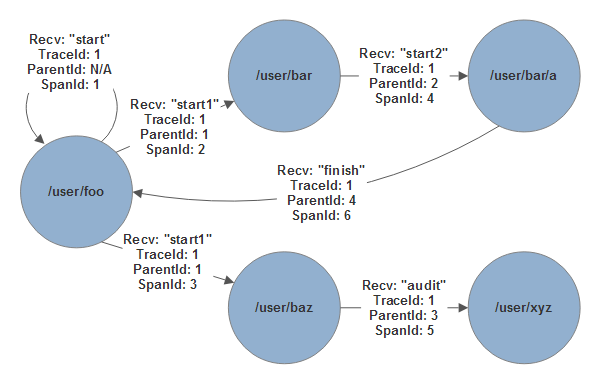
Trace Correlation
Messages flowing through actors automatically create correlated trace spans
Distributed Trace Graph
Complete trace visualization showing the flow of messages through your actor system
The trace stops when actors stop producing new messages in response to ones they've previously received.
If I have the following actor from the Quickstart Tutorial:
public sealed class RouterForwarderActor : ReceiveActor
{
    private readonly ILoggingAdapter _log = Context.GetLogger();
    private readonly IActorRef _routerActor;

    public RouterForwaderActor(IActorRef routerActor)
    {
        _routerActor = routerActor;
        Receive<string>(_ =>
        {
            _log.Info("Received: {0}", _);
            _routerActor.Forward(_);
        });
    }
}
And I see the actor a string message:
IActorRef myActor = sys.ActorOf(Props.Create(() => new RouterForwaderActor(otherActor)), "fwd")
myActor.Tell("foo");
This will generate a trace called akka.actor.recv String in our tracing system, whether it's Jaeger, Application Insights, DataDog, or something else:
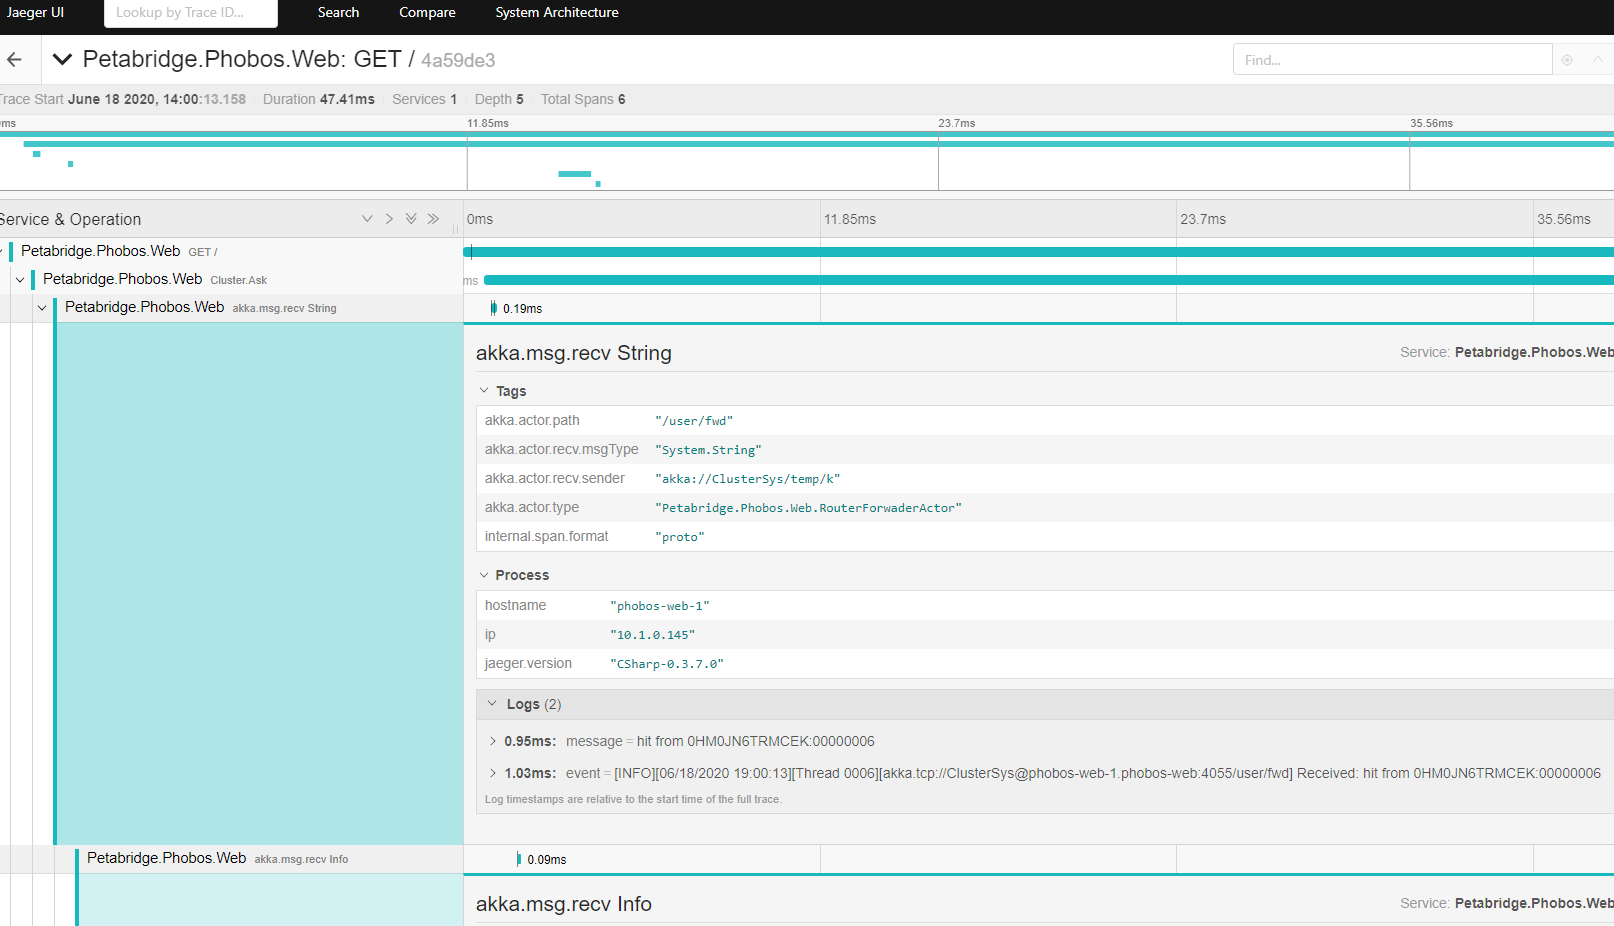
Jaeger Trace Details
Detailed trace view showing actor message processing, timing, and metadata in Jaeger UI
In this instance we're using Jaeger, one of the many tools Phobos supports, to capture our tracing data - but the data will be the more or less the same no matter which tracing or monitoring back-end you use.
Data Included in Actor Message Traces
All actor trace data includes the following pieces of information:
Tags
akka.actor.path- the absolute path of this actor;akka.actor.recv.msgType- the assembly + type name of this message;akka.actor.recv.sender- the absolute path of the actor who sent this message; andakka.actor.type- the implementation class of the actor who recorded this span.
Events and Logs
- Any information captured using the
ILoggingAdapterin Akka.NET is automatically appended as a log event to the currently active span. - The
.ToString()output of the current message is always appended to the active span. - In the event of an actor crash or an exception thrown while processing a message, all of the relevant error details are captured and tagged into that span.
- All
Ask<T>operations automatically record a trace on the sender side with anakka.actor.ask <ExpectedResponseType>operation name and a correspondingakka.msg.recv <InputMessageType>trace for the actor who is on the receiving side of theAsk<T>operation. This trace will also record the end-to-end duration it took to complete theAsk<T>as well any any timeouts or exceptions thrown by it. - Any time a message is stashed and subsequently unstashed, you will see
akka.msg.stashakka.msg.unstashevents appear attached to theakka.msg.recv <messageType>span that the actor originally processed.
Latency Tracking
Phobos tracks latency on all traced messages using the following syntax:
- Trace starts the moment
IActorRef.Tellis called; - A new event, called
waiting, is recorded when the message starts being processed - the duration of thewaitingevent indicates how long the message was in-flight or sitting in a mailbox before it was processed; and - An event called 'message' will start when the message begins processing and will complete upon the actor's receive method exiting.
The combination of these two events (both part of the same TelemetrySpan / Activity) will measure the total end-to-end processing time per each traced message.
Note
If this is too noisy for large volume applications, you can disable this feature via phobos.tracing.log-message-events = off for individual actors or for the entire ActorSystem. This can also be accomplished using the Props.WithInstrumentation extension method instead of HOCON. See "Phobos Configuration."
Other Actor Events Captured During Tracing
We capture a number of other events during tracing too:
akka.actor.spawn- recorded when an actor is spawned by its parent.akka.actor.start- recorded during an actor'sPreStartmethod.akka.actor.restart- recorded during an actor'sPreRestartMethodimmediately following anakka.actor.crashevent.akka.actor.crash- recorded when an actor throws an unhandled exception during processing, and includes all of the error details.akka.msg.deadletter- recorded when a message can't be delivered.akka.msg.unhandled- recorded when a message was received by an actor, but the actor wasn't programmed to process it.akka.actor.ask <ExpectedResponseType>- recorded when anAsk<T>operation begins whenphobos.tracing.trace-ask=on(onby default.)akka.actor.stop- as of Phobos 2.6.0, we also capture actor termination events in Phobos. This feature played a pivotal role in Petabridge's investigation of a very tricky Heisenbug in Akka.Cluster.Sharding, which is why we decided to add it to Phobos for all customers.
Tracing Over the Network
Phobos.Tracing automatically registers a serializer behind the scenes that makes it possible to preserve SpanContext over Akka.Remote and Akka.Cluster connections transparently.
In a system like Jaeger, you'll see different nodes of the same service name but with different hostnames communicating when they're exchanging messages over the cluster.
Metric Data
Phobos uses OpenTelemetry to record several built-in metrics.
It's quite easy to take this data and construct it into a Grafana-friendly dashboard, like the one below:
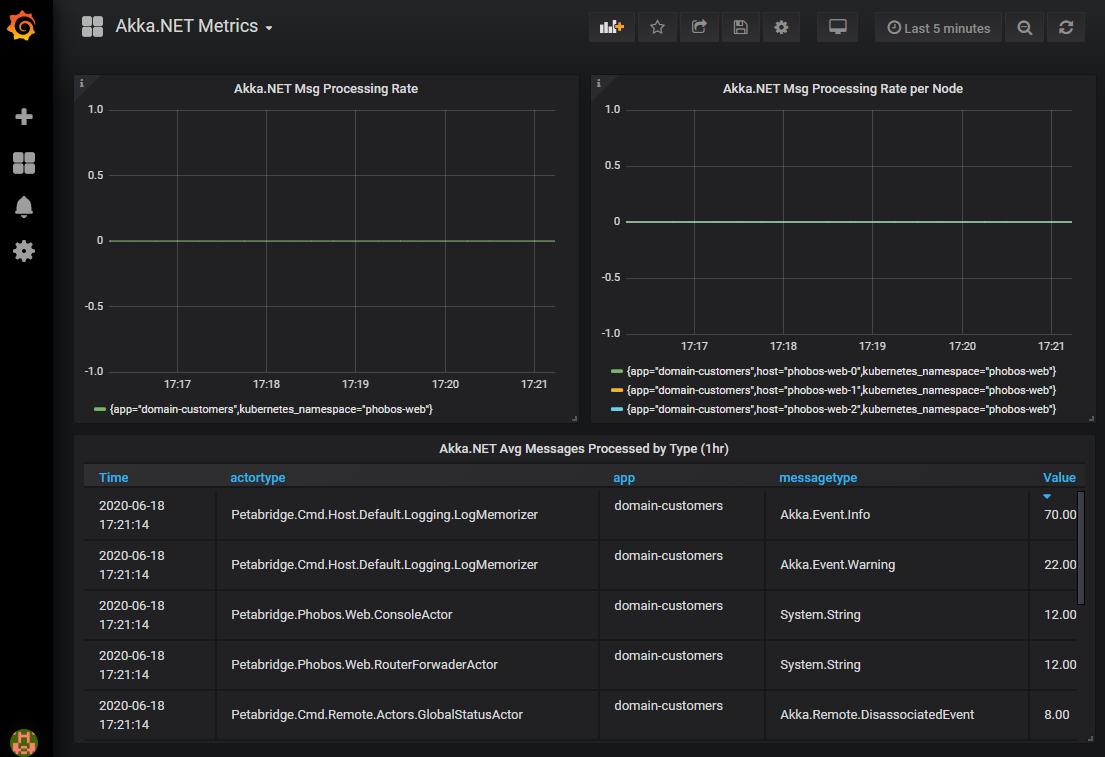
Grafana Dashboard
Production-ready Grafana dashboard visualizing Akka.NET metrics collected by Phobos and Prometheus
Important
We have an entire area of the Phobos website dedicated to sharing free, ready-to-use dashboards that will visualize all of these metrics for you. You can use Grafana with Prometheus, Grafana with InfluxDb, DataDog, and more! Check out our Phobos dashboards.
Counter and Meter Data
Message Processing Metrics
| Metric | Type | Dimensions | Description |
|---|---|---|---|
akka.messages.recv |
Counter | actortype, messagetype, actorpath |
Total messages received by actor/message type |
akka.messages.latency |
Histogram | actortype, messagetype |
End-to-end message processing time (milliseconds) |
akka.actor.mailbox.depth |
Gauge | actortype, actorpath |
Current mailbox queue depth |
akka.messages.deadletters |
Counter | messagetype, sender, recipient |
Dead letter messages by type |
akka.messages.unhandled |
Counter | actortype, messagetype |
Unhandled messages by actor/message type |
Actor Lifecycle Metrics
| Metric | Type | Dimensions | Description |
|---|---|---|---|
akka.actor.created |
Counter | actortype, actor_category |
Total actors created |
akka.actor.stopped |
Counter | actortype, actor_category |
Total actors stopped |
akka.actor.live |
Gauge | actortype, actor_category |
Current number of live actors |
akka.actor.restarts |
Counter | actortype, exceptiontype, actor_category |
Actor restarts with exception details |
Logging Metrics
| Metric | Type | Dimensions | Description |
|---|---|---|---|
akka.logs |
Counter | level, exceptiontype, logger |
Log messages by level and exception type |
Important
In order to use akka.actor.live you will need to set akka.actor.telemetry.enabled = on (it's off by default.)
If you use Phobos.Hosting to configure Phobos, this setting will be automatically enabled for you.
Cluster and Sharding Metrics
When using Akka.Cluster, Phobos automatically captures additional metrics about cluster health and entity distribution:
Cluster Membership Metrics
| Metric | Type | Dimensions | Description |
|---|---|---|---|
akka.cluster.members |
Gauge | status, cluster_role |
Cluster members by role and MemberStatus |
akka.cluster.reachable |
Gauge | status, cluster_role |
Reachable/unreachable members by role |
Cluster Sharding Metrics
| Metric | Type | Dimensions | Description |
|---|---|---|---|
akka.cluster.sharding.shards |
Gauge | entity_type, node |
Number of shards per node per entity type |
akka.cluster.sharding.entities |
Gauge | entity_type, node |
Number of entities per node per entity type |
Log Data
Phobos seamlessly integrates Akka.NET logging with OpenTelemetry's logging pipeline, ensuring that all logs generated by your actors are automatically correlated with traces and made available in your observability platform.
Automatic Log-to-Trace Correlation
Note
Phobos 2.11.0+: The AppendLogsToTrace feature (which appended actor logs as span events) now defaults to off and is deprecated. The recommended approach is to use LoggerFactoryLogger with AddAkkaTraceCorrelation() for proper structured logging with trace correlation. See the Migration Guide for details.
When using LoggerFactoryLogger with AddAkkaTraceCorrelation(), actor logs are emitted as first-class log records with full structured properties and trace correlation:
public sealed class ProcessingActor : ReceiveActor
{
    private readonly ILoggingAdapter _log = Context.GetLogger();

    public ProcessingActor()
    {
        Receive<ProcessOrder>(order =>
        {
            // With LoggerFactoryLogger, structured properties are preserved
            // OrderId, CustomerId become individually queryable fields
            _log.Info("Processing order {OrderId} for customer {CustomerId}",
                order.Id, order.CustomerId);

            // Any subsequent logs are also captured with trace correlation
            _log.Debug("Order details: {OrderDetails}", order);

            // Process the order...
        });
    }
}
These logs appear as proper log records in your observability platform, with each structured property (e.g., OrderId, CustomerId) available as a queryable field. The Akka.TraceId and Akka.SpanId fields link each log record to the Phobos trace span that was active during message processing.
Microsoft.Extensions.Logging Integration with Akka.Hosting
Akka.Hosting provides seamless integration with ILoggerFactory from Microsoft.Extensions.Logging, allowing you to unify your logging infrastructure:
using Akka.Hosting;
using Microsoft.Extensions.Hosting;

var builder = Host.CreateDefaultBuilder(args);

builder.ConfigureServices((context, services) =>
{
    services.AddAkka("MyActorSystem", configurationBuilder =>
    {
        configurationBuilder
            .ConfigureLoggers(setup =>
            {
                // Set the minimum log level
                setup.LogLevel = LogLevel.DebugLevel;

                // Clear default loggers
                setup.ClearLoggers();

                // Add the ILoggerFactory logger - this bridges Akka.NET logging
                // to Microsoft.Extensions.Logging and OpenTelemetry
                setup.AddLoggerFactory();
            })
            .WithActors((system, registry) =>
            {
                // Your actor configuration
            });
    });
});
With this configuration, all logs from Akka.NET actors flow through the Microsoft.Extensions.Logging pipeline and can be exported to OpenTelemetry.
Configuring OpenTelemetry Logging Pipeline
To export logs to OpenTelemetry with Akka.NET trace correlation, configure the Microsoft.Extensions.Logging pipeline with the OpenTelemetry exporter and AddAkkaTraceCorrelation():
using Akka.Hosting;
using OpenTelemetry.Logs;
using OpenTelemetry.Resources;

builder.Services.AddLogging(logging =>
{
    logging.AddOpenTelemetry(options =>
    {
        // Configure resource attributes
        options.SetResourceBuilder(
            ResourceBuilder.CreateDefault()
                .AddService(serviceName: "MyAkkaService", serviceVersion: "1.0.0")
                .AddAttributes(new Dictionary<string, object>
                {
                    ["deployment.environment"] = "production",
                    ["service.namespace"] = "phobos-demo"
                }));

        // Include scopes for better context
        options.IncludeScopes = true;
        options.IncludeFormattedMessage = true;

        // Enable Akka.NET trace correlation on log records
        // This links actor log records to Phobos trace spans
        options.AddAkkaTraceCorrelation();

        // Add OTLP exporter for sending logs to your observability platform
        options.AddOtlpExporter(otlpOptions =>
        {
            // Configure the endpoint for your OTLP collector
            otlpOptions.Endpoint = new Uri("http://localhost:4317");
            // Or use environment variables: OTEL_EXPORTER_OTLP_ENDPOINT
        });
    });
});
Required NuGet Packages
To enable OpenTelemetry logging with Phobos and Akka.Hosting, install these packages using the .NET CLI:
# Install the latest versions
dotnet add package Akka.Hosting
dotnet add package OpenTelemetry.Extensions.Hosting
dotnet add package OpenTelemetry.Exporter.OpenTelemetryProtocol
The .NET CLI will automatically add the latest stable versions to your project file. For the latest versions and additional information:
- Akka.Hosting on NuGet
- OpenTelemetry.Extensions.Hosting on NuGet
- OpenTelemetry.Exporter.OpenTelemetryProtocol on NuGet
Log Filtering Configuration
When using ILoggerFactory with Akka.NET, there are two log filters that must be configured correctly:
- Akka.NET Log Level - Set via
ConfigureLoggersin code - Microsoft.Extensions.Logging Filters - Set via
appsettings.json
Configure your appsettings.json to control log levels:
{
  "Logging": {
    "LogLevel": {
      "Default": "Information",
      "Microsoft": "Warning",
      "Microsoft.Hosting.Lifetime": "Information",
      "Akka": "Debug"  // Enable debug logging for Akka.NET
    }
  }
}
What Gets Logged
With this integration, Phobos automatically captures and exports:
- Actor lifecycle events: Start, restart, stop, and crash events
- Message processing logs: Any logs emitted during message handling
- System events: Cluster events, sharding events, and remoting logs
- Error details: Full exception information with stack traces
- Custom application logs: Any logs you emit using
ILoggingAdapter
All logs are automatically enriched with:
- Trace and span IDs for correlation
- Actor path and type information
- Message type being processed
- Timestamp and severity level
- Custom attributes from your logging statements
This comprehensive logging integration ensures you have complete visibility into your Akka.NET application's behavior, with all logs properly correlated to traces and metrics in your observability platform.
Customizing Phobos Data Labels
In addition to Phobos' extensive filtering and configuration support for controlling what you collect from Akka.NET, Phobos also has some options for controlling what the collected output looks like.
Actor Type Names
One major issue we resolved in Phobos 2.7.0 is Actor type information and F# API, where Akkling users noticed that all of their F# actors all had identical names in Phobos's metrics and traces due to the way the F# actor type system works differently from C#.
In order to resolve this, we made it possible to customize the actor's type name via Phobos' configuration:
// Customize how the actor appears in traces and metrics
var props = Props.Create<InstrumentedActor>()
    .WithInstrumentation(new PhobosActorSettings(
        trace: true,
        monitor: true,
        actorTypeName: "CriticalBusinessActor"));

var myActor = Sys.ActorOf(props, "business-actor");
In Phobos' automatically collected metrics, the actortype attribute will now use Foo instead of Assembly.Namespace.MyActor.
In Phobos's automatically collected traces, the akka.actor.type attribute will now use Foo instead of Assembly.Namespace.MyActor.