Phobos Dashboards
Overview
Stop flying blind in production. These Grafana dashboards give you instant visibility into your Akka.NET cluster's actual behavior - see which actors are struggling, where messages are piling up, and what's causing those 3am alerts.
Same stack Microsoft uses for ASP.NET Core. Same stack Netflix uses. Same stack your DevOps team already knows. We didn't reinvent the wheel - we built on the industry standard that's monitoring millions of production systems right now. Your metrics work everywhere because they're OpenTelemetry, but these dashboards are the fastest path to production insight.
What You Get
- Find bottlenecks before your users do - See exactly which actors are slow, which mailboxes are backing up, and where your cluster is struggling
- Debug production issues in seconds - Real actor counts, message rates, and error breakdowns mean you can diagnose problems without diving into logs
- Import and go - Two clicks in Grafana Cloud. That's it. No custom queries, no dashboard building, no guesswork
- Works with your existing stack - OpenTelemetry metrics export to DataDog, New Relic, Azure Monitor, or anywhere else you're already paying for
Available Dashboards
Source Code: https://github.com/petabridge/phobos-dashboards
Grafana Cloud Dashboards:
- Cluster Overview Dashboard: https://grafana.com/grafana/dashboards/15637
- Actor Performance Dashboard: https://grafana.com/grafana/dashboards/15638
🌐 Cluster Overview Dashboard
Monitor your entire Akka.NET cluster's health and performance metrics at a glance.
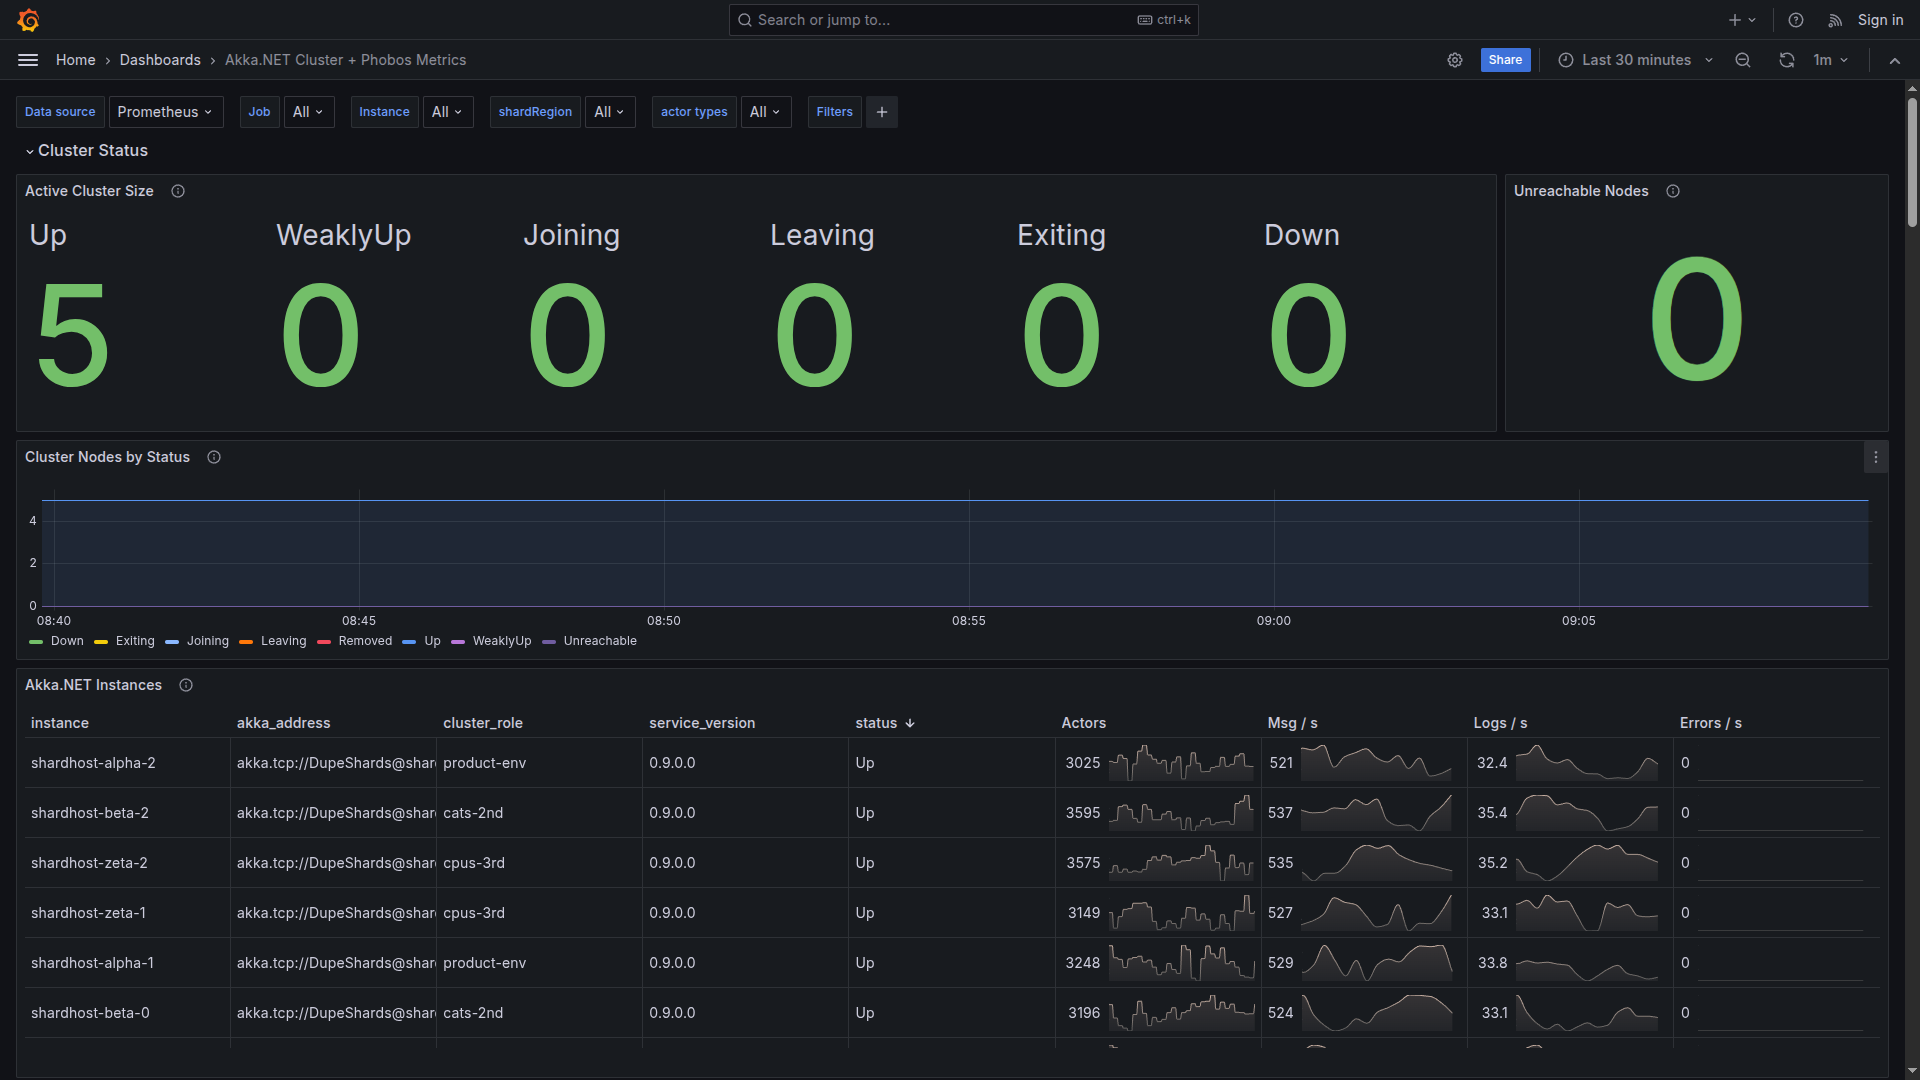
Cluster Status & Node Health
Real-time cluster membership tracking with node status, message rates, and instance details
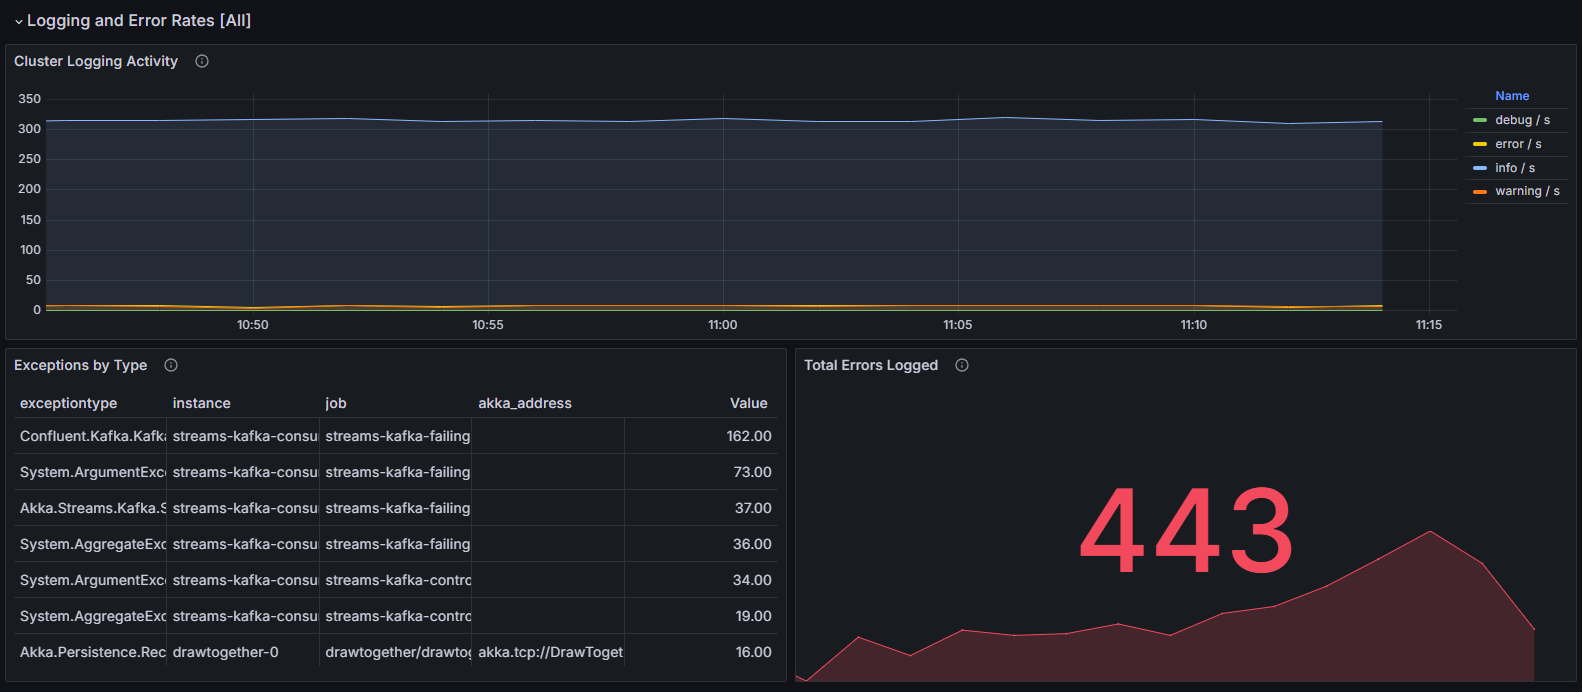
Logging & Error Tracking
Monitor logging activity, exception rates, and error type breakdowns across the cluster
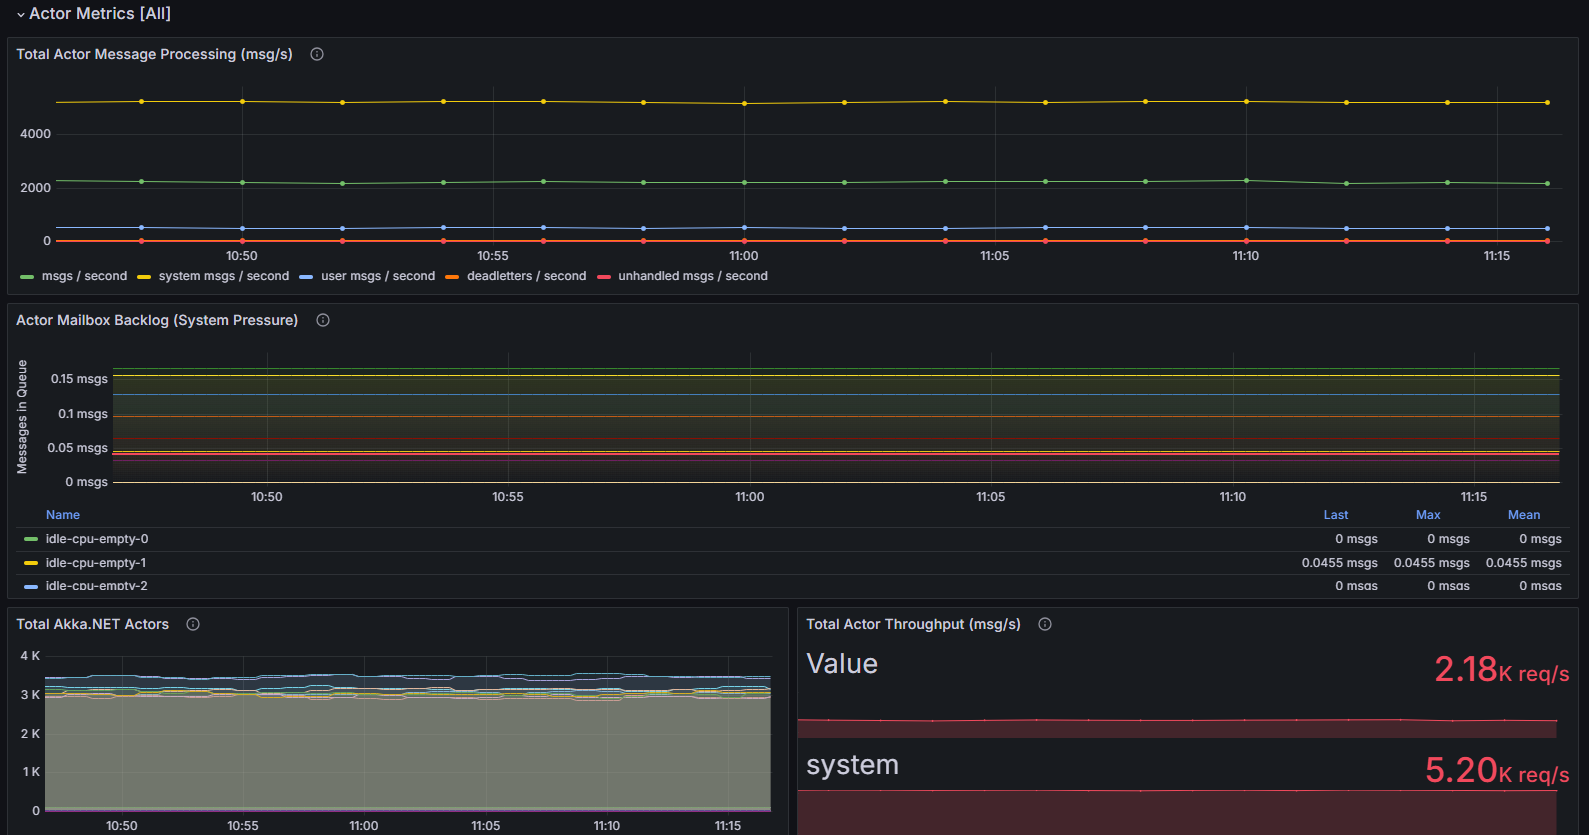
Actor Metrics & Backpressure
Track actor message processing, mailbox backlogs, and throughput per node
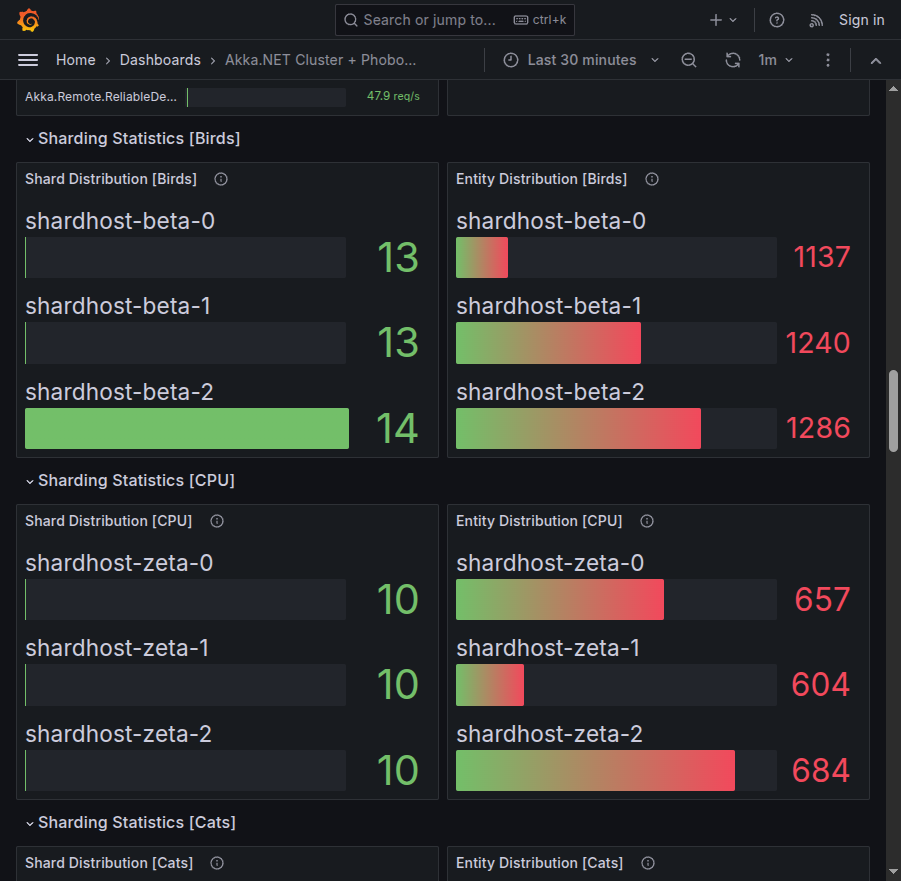
Sharding Statistics
Detailed sharding distribution with message type breakdowns and throughput analysis
⚡ Actor Performance Dashboard
Deep-dive into individual actor performance metrics and message processing patterns.
**Grafana Cloud**: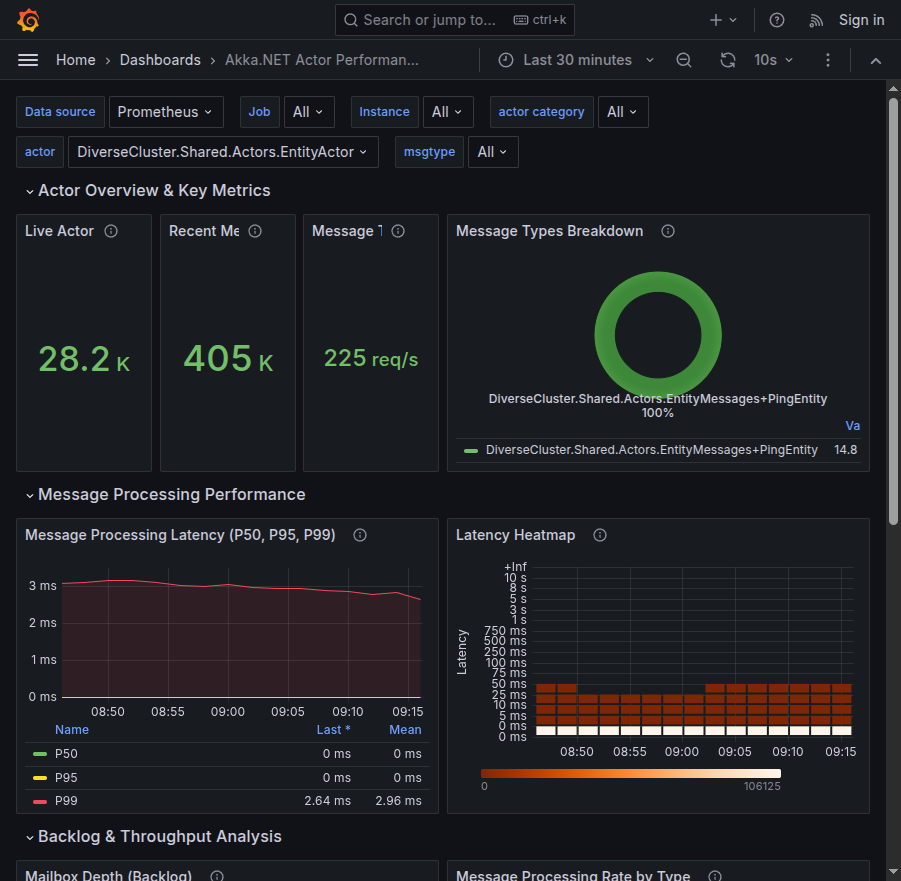
Actor Overview & Key Metrics
Real-time actor counts, message volumes, throughput rates, and latency heatmaps
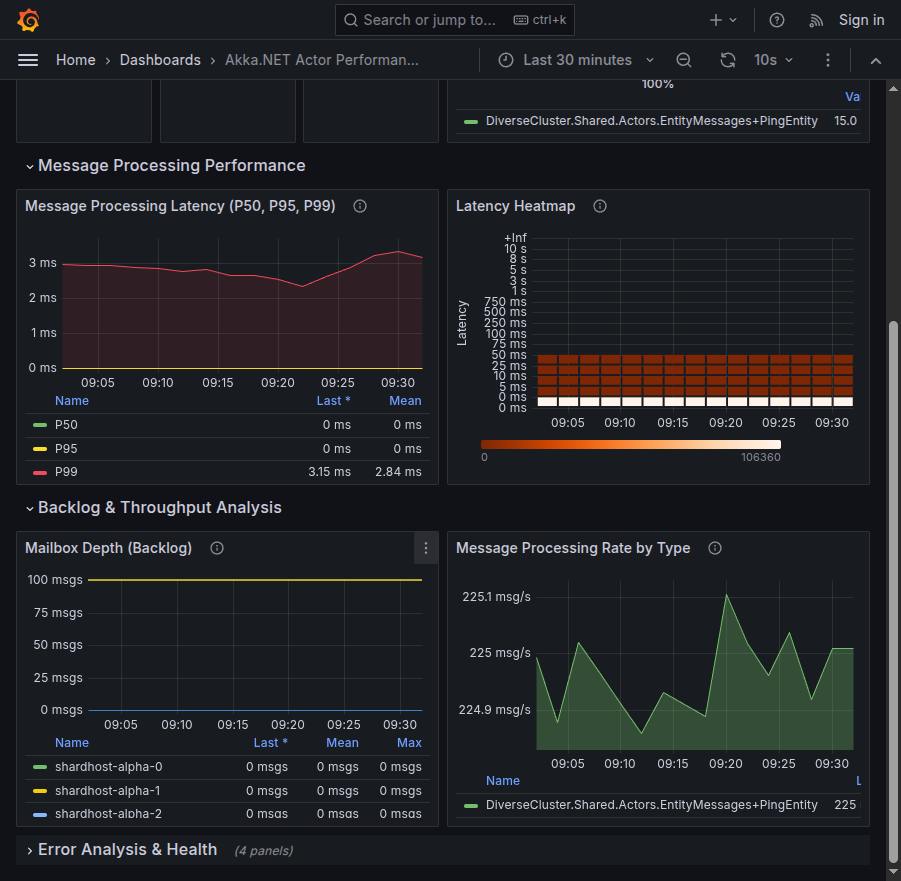
Detailed Performance Analysis
Message processing latencies, mailbox depths, and per-instance throughput metrics
Installation
Prerequisites
- ✅ Grafana 8.0 or later
- ✅ Prometheus data source configured
- ✅ Akka.NET application instrumented with Phobos 2.x
- ✅ OpenTelemetry metrics exporter configured (see integrations guide)
Quick Import from Grafana Cloud
- Navigate to Dashboards → Import in your Grafana instance
- Enter the dashboard ID:
- Select your Prometheus data source
- Click Import
Manual Installation
- Download the dashboard JSON files from: https://github.com/petabridge/phobos-dashboards
- Navigate to Dashboards → Import in Grafana
- Upload or paste the JSON content
- Select your Prometheus data source
- Click Import
Key Metrics Reference
| Metric | Description | Dashboard |
|---|---|---|
| Actor System Metrics | ||
akka_actor_live_actors |
Number of active actors in the system | Both |
akka_actor_restarts_total |
Total actor restarts (indicates failures) | Both |
akka_actor_mailbox_depth_msgs |
Messages waiting in actor mailboxes | Both |
| Message Flow Metrics | ||
akka_messages_recv_msgs_total |
Total messages received by actors | Both |
akka_messages_latency_milliseconds_bucket |
Message processing latency histogram | Performance |
akka_messages_deadletters_msgs_total |
Messages sent to dead letters | Both |
akka_messages_unhandled_msgs_total |
Unhandled messages | Both |
| Cluster Metrics | ||
akka_cluster_members |
Current cluster member count | Cluster |
akka_cluster_reachable_members |
Reachable cluster members | Cluster |
akka_address |
Node address information | Cluster |
| Sharding Metrics | ||
akka_cluster_sharding_entities |
Number of sharded entities | Cluster |
akka_cluster_sharding_shards |
Number of active shards | Cluster |
| Logging Metrics | ||
akka_logs_events_total |
Log events by severity level | Cluster |
For a complete list of available metrics, see What Data Does Phobos Capture?
Adapting to Other Platforms
These Grafana dashboards serve as a reference implementation. The PromQL queries, panel configurations, and metric selections can be adapted to other monitoring platforms like DataDog, New Relic, or Azure Monitor. Since Phobos exports standard OpenTelemetry metrics, your data is portable across any OpenTelemetry-compatible backend.
Translation Guide
- Metrics: All
akka_*prefixed metrics are available via OpenTelemetry - Queries: PromQL queries can be translated to other query languages
- Visualizations: Panel types and configurations provide blueprint for other platforms
- Alerts: Threshold values and conditions are platform-agnostic
Troubleshooting
Dashboard shows "No Data"
- Verify Prometheus is receiving metrics:
curl http://prometheus:9090/api/v1/label/__name__/values | grep akka - Check data source configuration in Grafana
- Ensure time range selection includes recent data
- Validate Phobos is configured correctly
Missing Panels or Metrics
- Confirm Phobos monitoring is enabled
- Check OpenTelemetry exporter configuration
- Verify Prometheus scrape configuration includes your application
- Review application logs for metric export errors
Performance Impact
See our Performance Impact documentation for guidance on optimizing Phobos overhead.
Support & Resources
- 🐛 Report Dashboard Issues: https://github.com/petabridge/phobos-dashboards/issues
- 🚀 Try the QuickStart Tutorial - includes pre-configured dashboards