Introduction to Phobos.Monitoring
Phobos.Monitoring defines the following types of metrics out of the box:
- Counters - for measuring component throughput;
- Gauges - for measuring changes in values over time; and
- Timings - for measuring the duration of individual operations.
These are the supported metric types and they work consistently regardless of which type of back-end you choose.
Read more about how Phobos works in general.
Concepts
Software monitoring is fundamentally an operational concept; in production environments developers monitor their applications in order to assess the following:
- Quality of service - how well are we servicing our users or customers? What's the average end-to-end latency for a request?
- Total system throughput and demand - how much service are we providing at any given time?
- Fault rates - what percentage of our requests are completely successfully? How often do we timeout?
- Resource monitoring - how much memory and CPU usage are we consuming? How much bandwidth?
Monitoring is also closely associated with the concept of "alerting" systems too; alerting systems typically consume the data produced by a monitoring system and can use those to notify the people responsible for the operation of the software that something requires immediate human attention.
Phobos automatically captures most of the relevant monitoring data for you through the use of Phobos' integration with Akka.NET actors. For the parts that we can't automatically capture, we expose the tools for you to do it.
Captured Metrics
For details on the types of metrics that Phobos captures automatically for individual actors and ActorSystem instances, please click here.
Global, Node-Specific, Class-Specific, and Actor-Specific Metrics
Phobos.Monitoring allows for extremely fine-grained monitoring out of the box - if you want to know how many messages per second the actor at /user/ops/router1/$d on node akka.tcp://MyCluster@localhost:9110 is processing, Phobos captures data down to that level of detail automatically.
Or - if you want to know how many messages per second all actors at /user/ops/router1/$d across the entire cluster_ are processing, Phobos capture that too.
One of the really handy features of Phobos.Monitoring is that's built to gather metrics along several different dimensions at all times. We do this because, naturally, software developers and operators may want to investigate performance issues with a specific piece of code, a specific piece of hardware, or a combination of the two. Thus, it's helpful to provide the external monitoring systems we integrate with the ability to automatically expand and view that data as they see fit.
Here's an example of what the messages.recv counter (one of the built-in metrics) might look like across those different dimensions for a specific actor:
| By Actor Class | By Actor Path | ||
|---|---|---|---|
| Cluster-wide | {actorSystem name}.{assembly-qualified type name of actor class}.messages.recv | {actorSystem name}.{path of actor in hierarchy}.messages.recv | |
| Node-specific | {nodeAddress}.{assembly-qualified type name of actor class}.messages.recv | {nodeAddress}.{path of actor in hierarchy}.messages.recv |
You don't have to explicitly tell Phobos to capture these dimensions for any of the built-in metrics - the Monitor does this automatically.
For user-defined metrics, Phobos will automatically a cluster-wide and a node-specific view of custom metrics but nothing actor or class-specific. You can choose the metric names yourself to accomplish the same effect, however.
Architecture and Data Flow
Just like in our Phobos.Tracing example, let's take two Akka.NET actors sending eachother messages as an example:
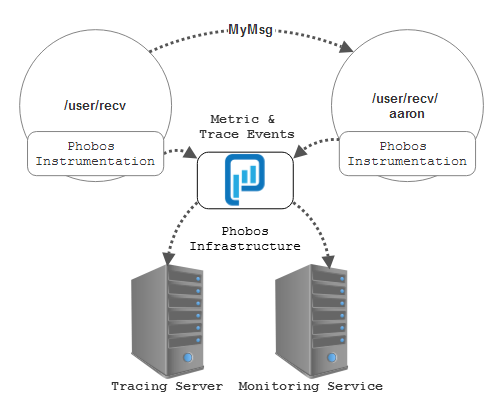
In this instance the child actor /user/recv/aaron will record the following datapoints to a supported monitoring backend, such as StatsD in this instance:
user.recv.aaron.messages.recv+1;ActorClassName.messages.recv+ 1;ActorSystem.Name.akka.messages.recv+1; andActorSystem.Name+ActorSystem.Address+.akka.messages.recv+ 1 (if we're running with Akka.Remote or Akka.Cluster enabled.)
And all of this data can be visualized in a tool like Grafana in this with a nice dashboard:
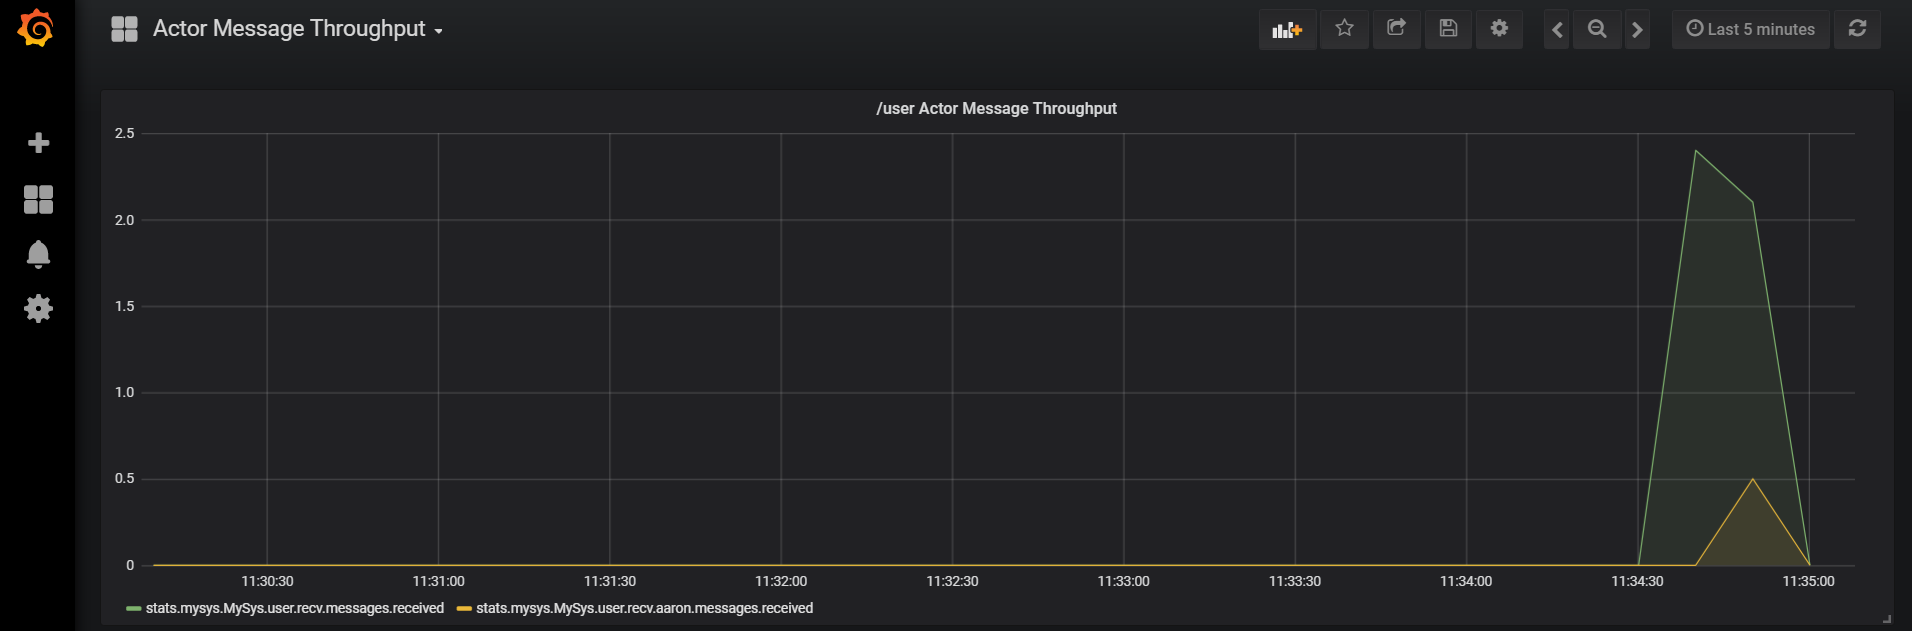
Click here for a full-sized image.
In this instance, StatsD is the Monitoring Engine that is being used by Phobos. The underlying Phobos metrics capture system is actively publishing its metrics out over the wire to a StatsD service.
Next: how to configure and use Phobos.Monitoring inside your Akka.NET applications.