Phobos QuickStart: OpenTelemetry for Akka.NET in 5 Minutes
Get OpenTelemetry metrics and traces from your Akka.NET application in minutes, not hours.
📦 Sample Repository: github.com/petabridge/Petabridge.Phobos.Web
What You Get
✅ Automatic distributed tracing - Every actor message traced across your cluster
✅ Production-ready Grafana dashboards - Professional visualizations, zero configuration
✅ Complete metrics - Actor throughput, latency, mailbox depth, cluster health
✅ OpenTelemetry native - Works with any OTLP-compatible backend
✅ Zero code changes - Just configuration
What You'll See
Get instant visibility into your Akka.NET applications with these integrated telemetry tools:
📊 Integrated Telemetry Tools
Monitor your distributed Akka.NET application with real-time metrics, traces, and logs from multiple perspectives.
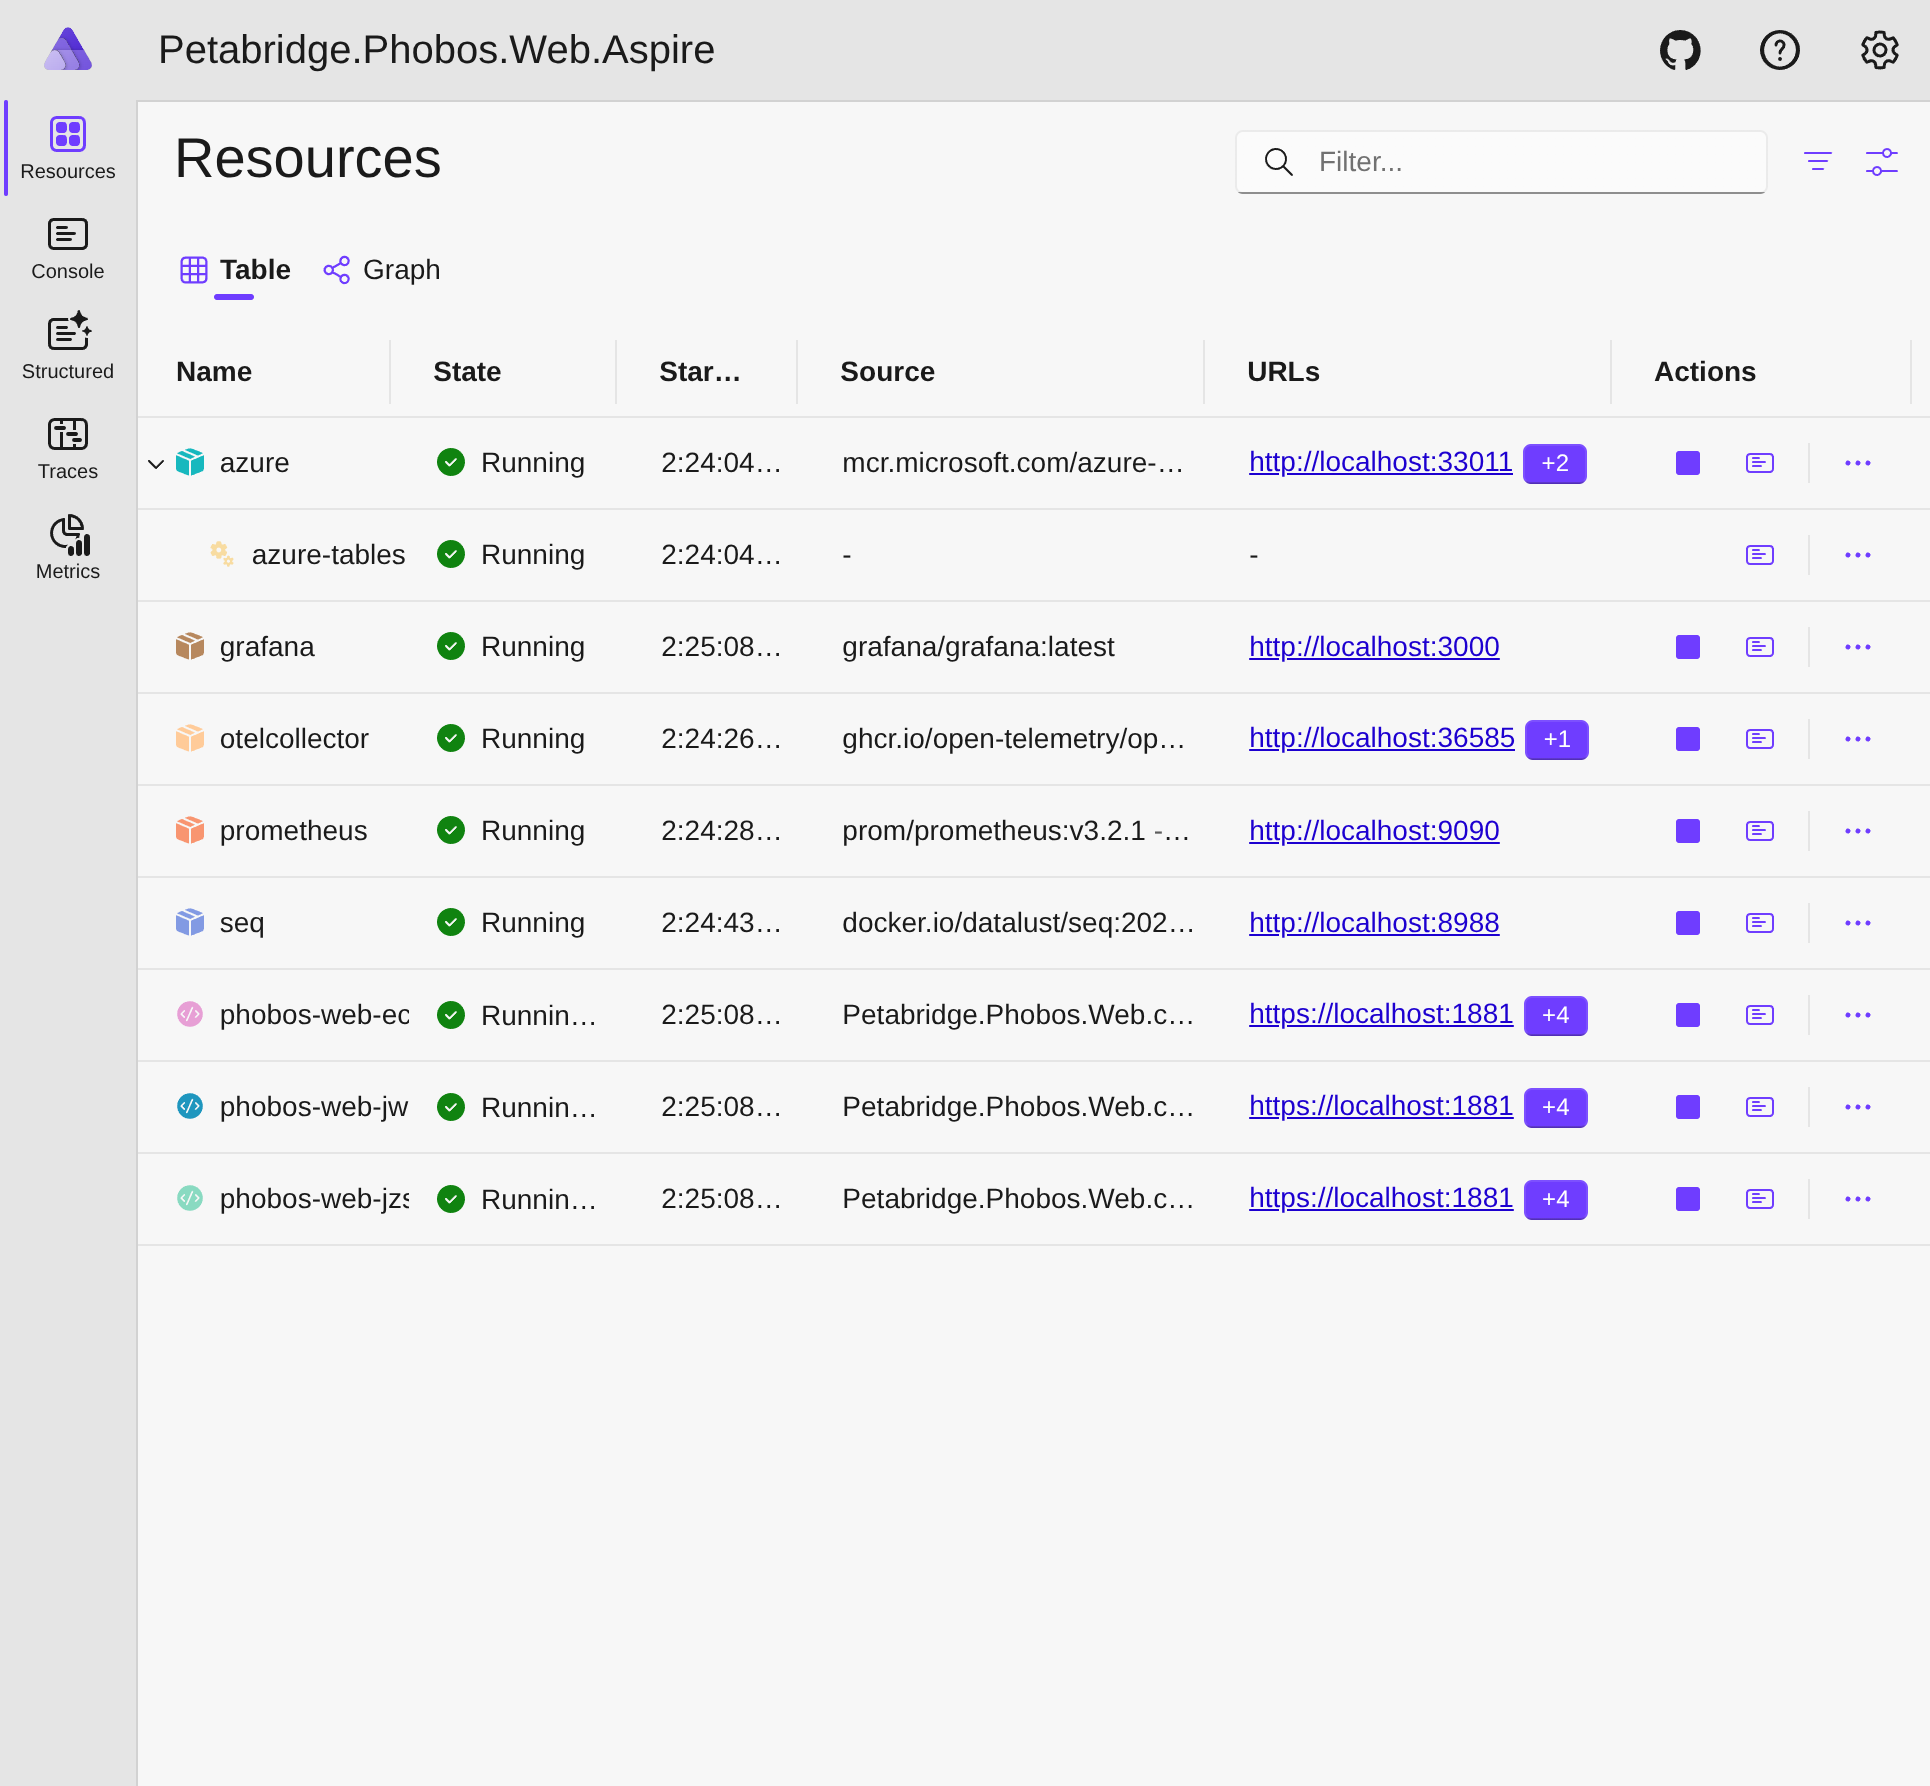
.NET Aspire Dashboard
Service orchestration with real-time distributed traces and metrics
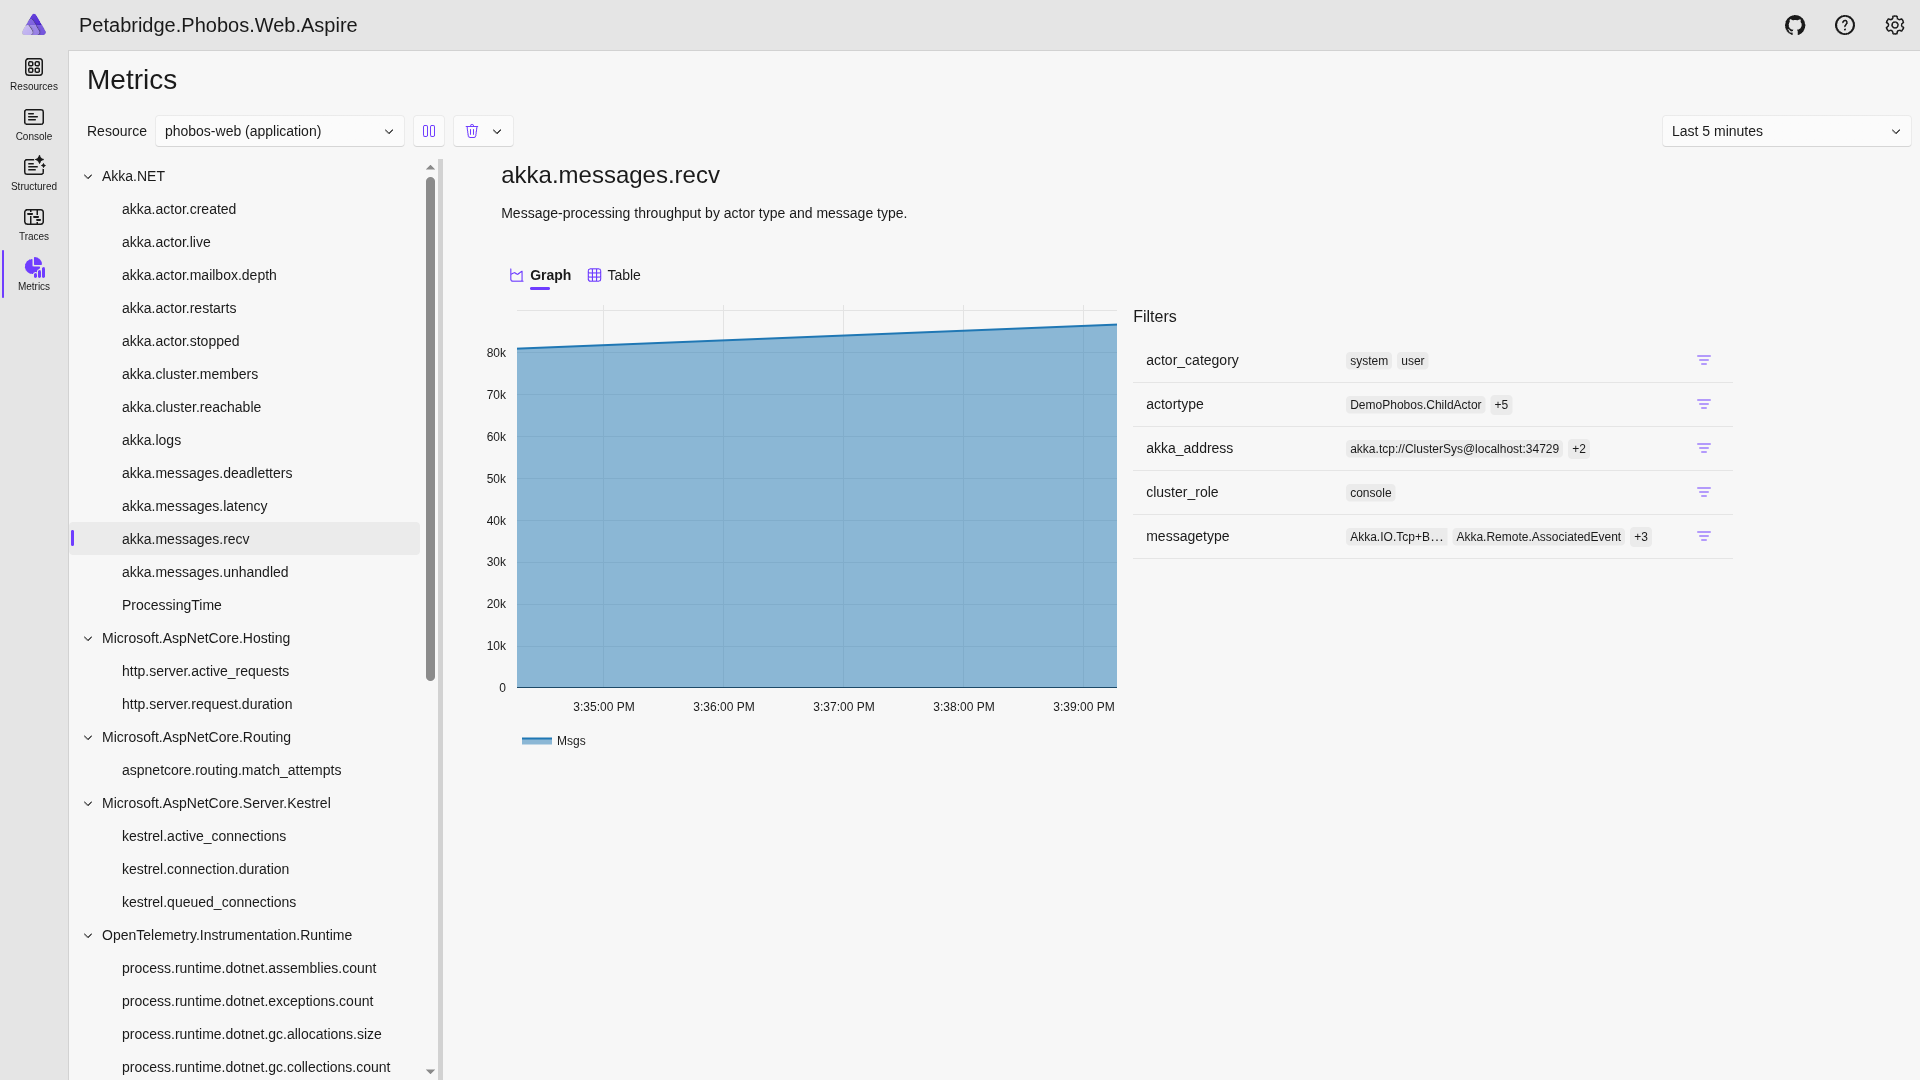
Aspire Metrics View
Detailed telemetry data for selected resources with interactive charts
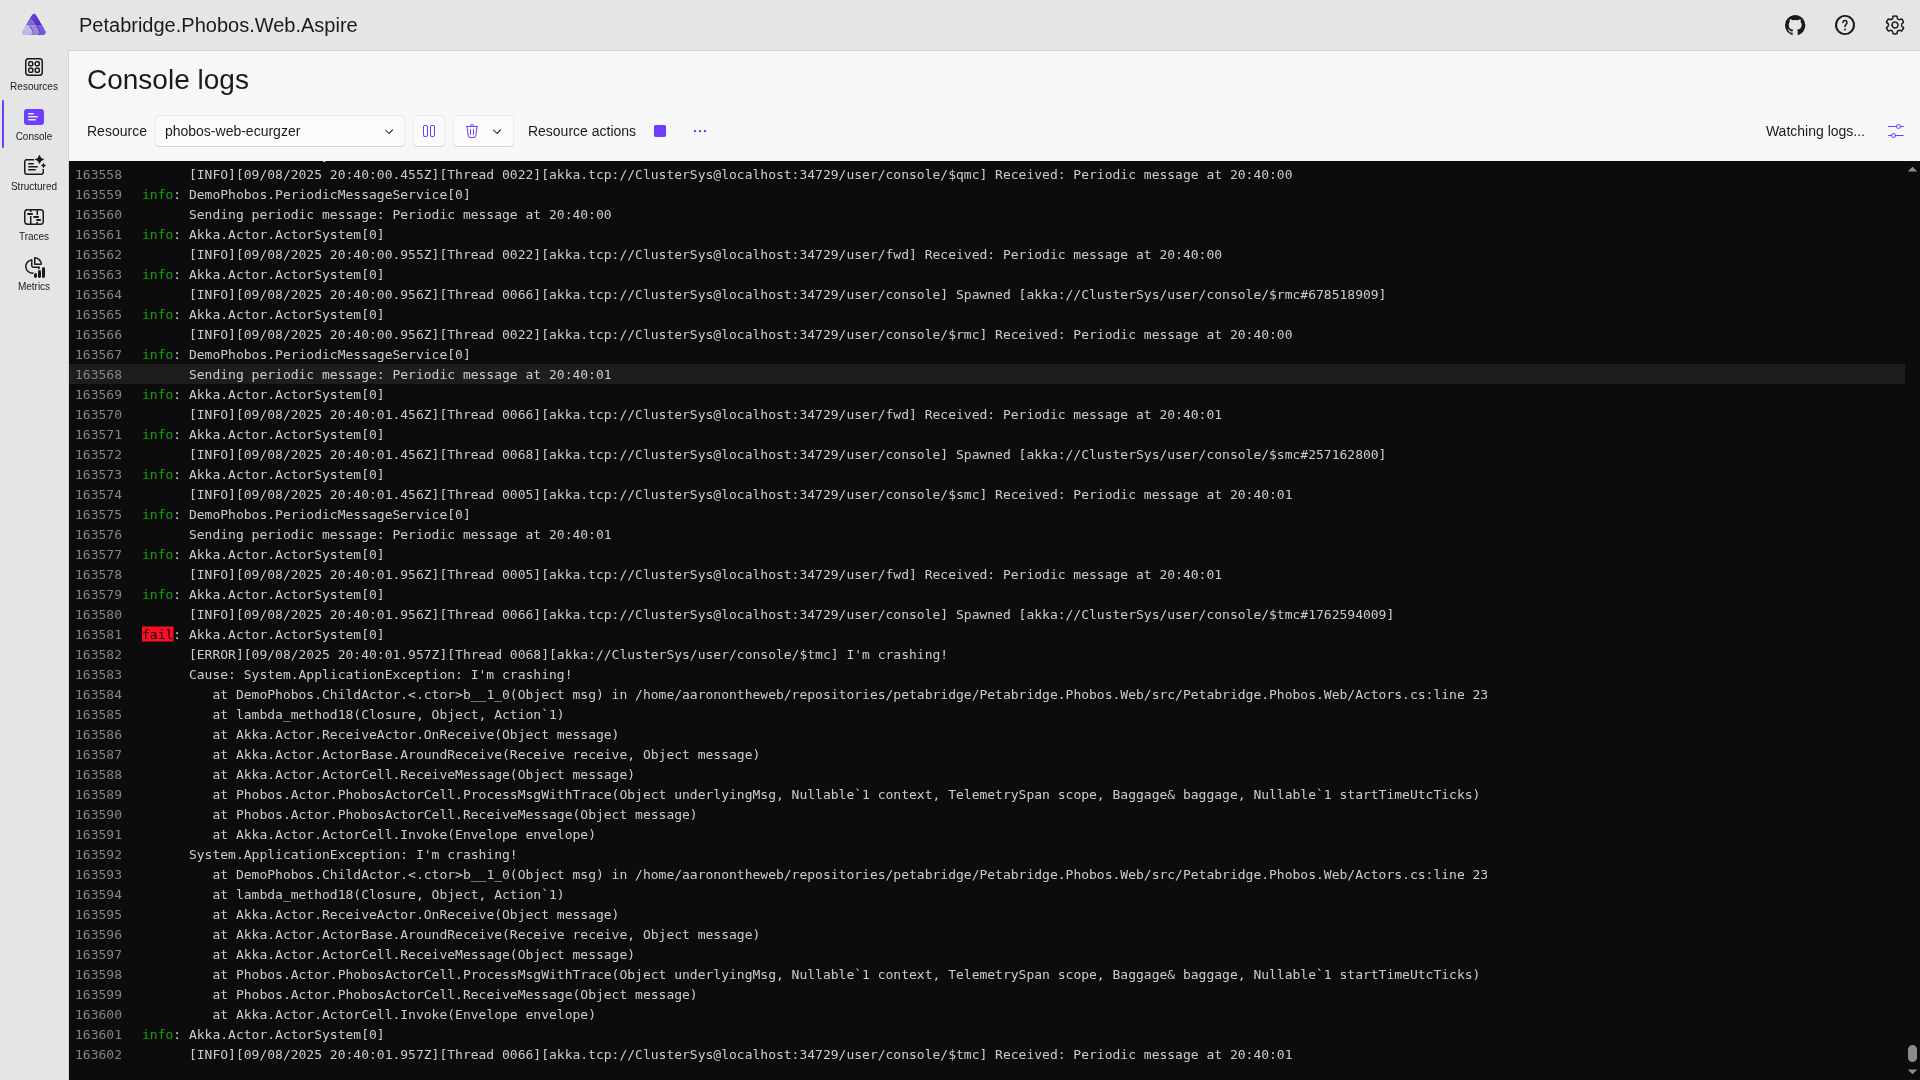
Aspire Logs View
Structured log exploration with filtering and search capabilities
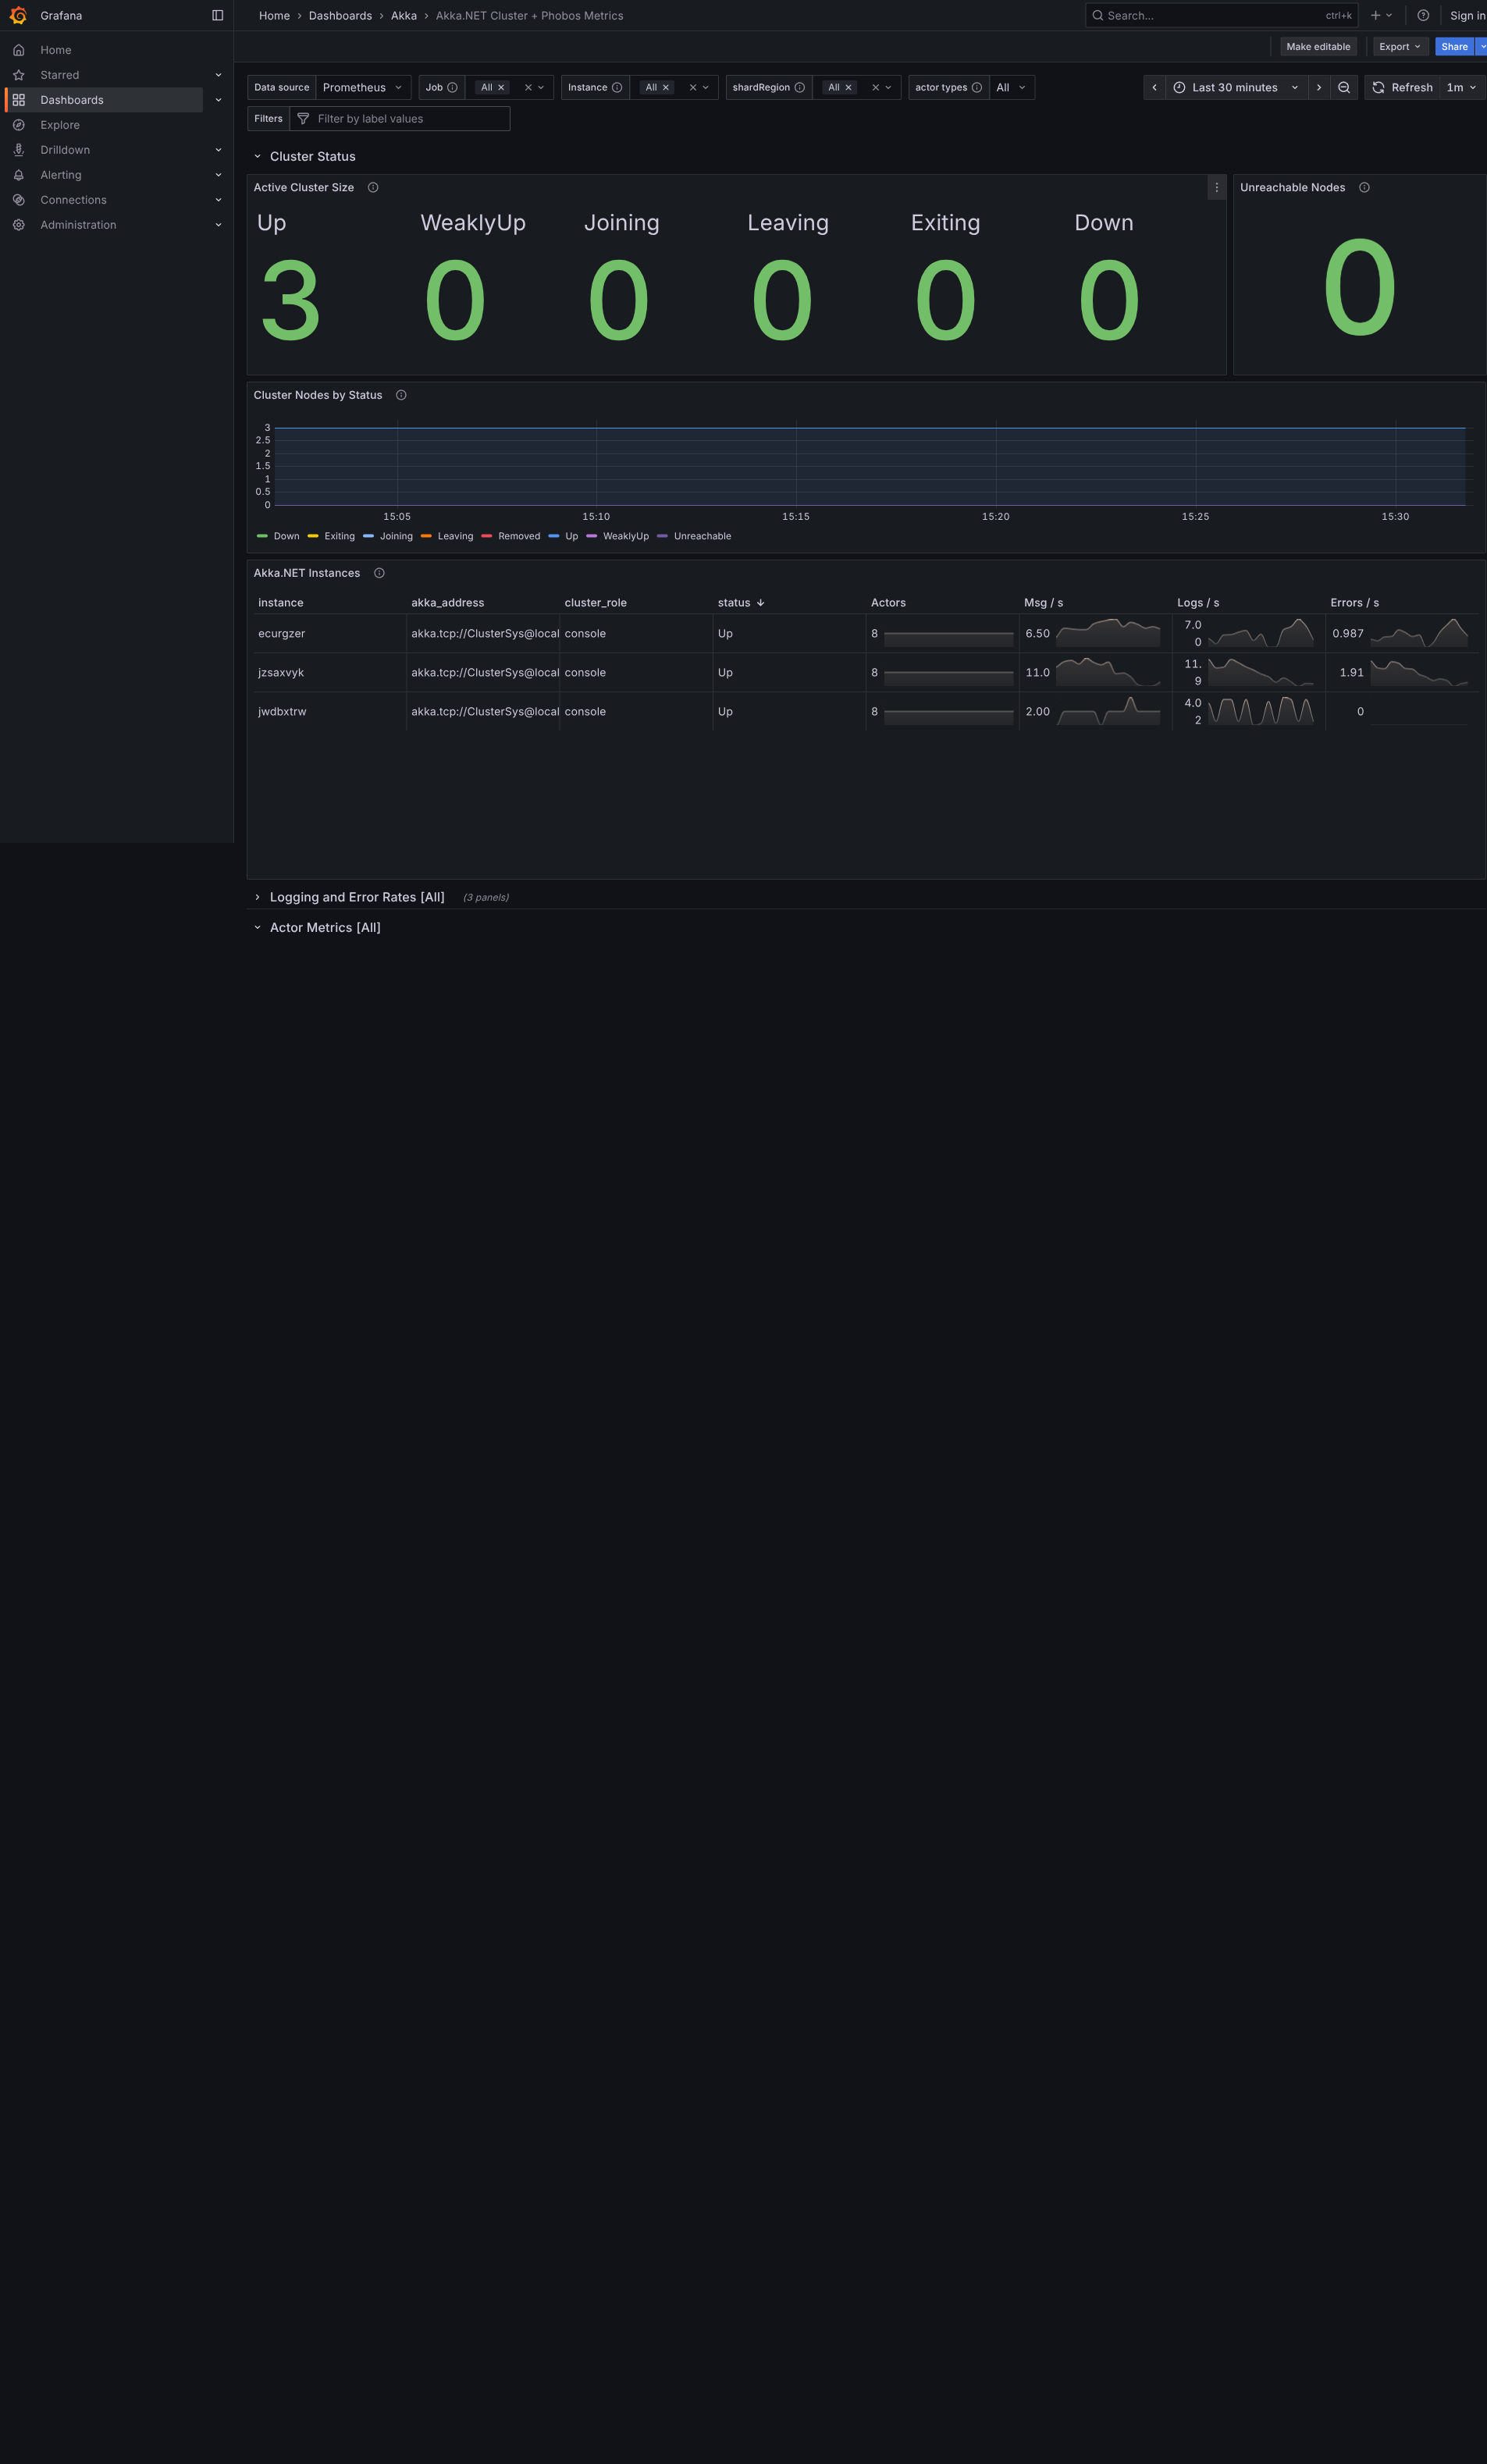
Grafana Dashboards
Production-ready Akka.NET dashboards used by Fortune 500 companies
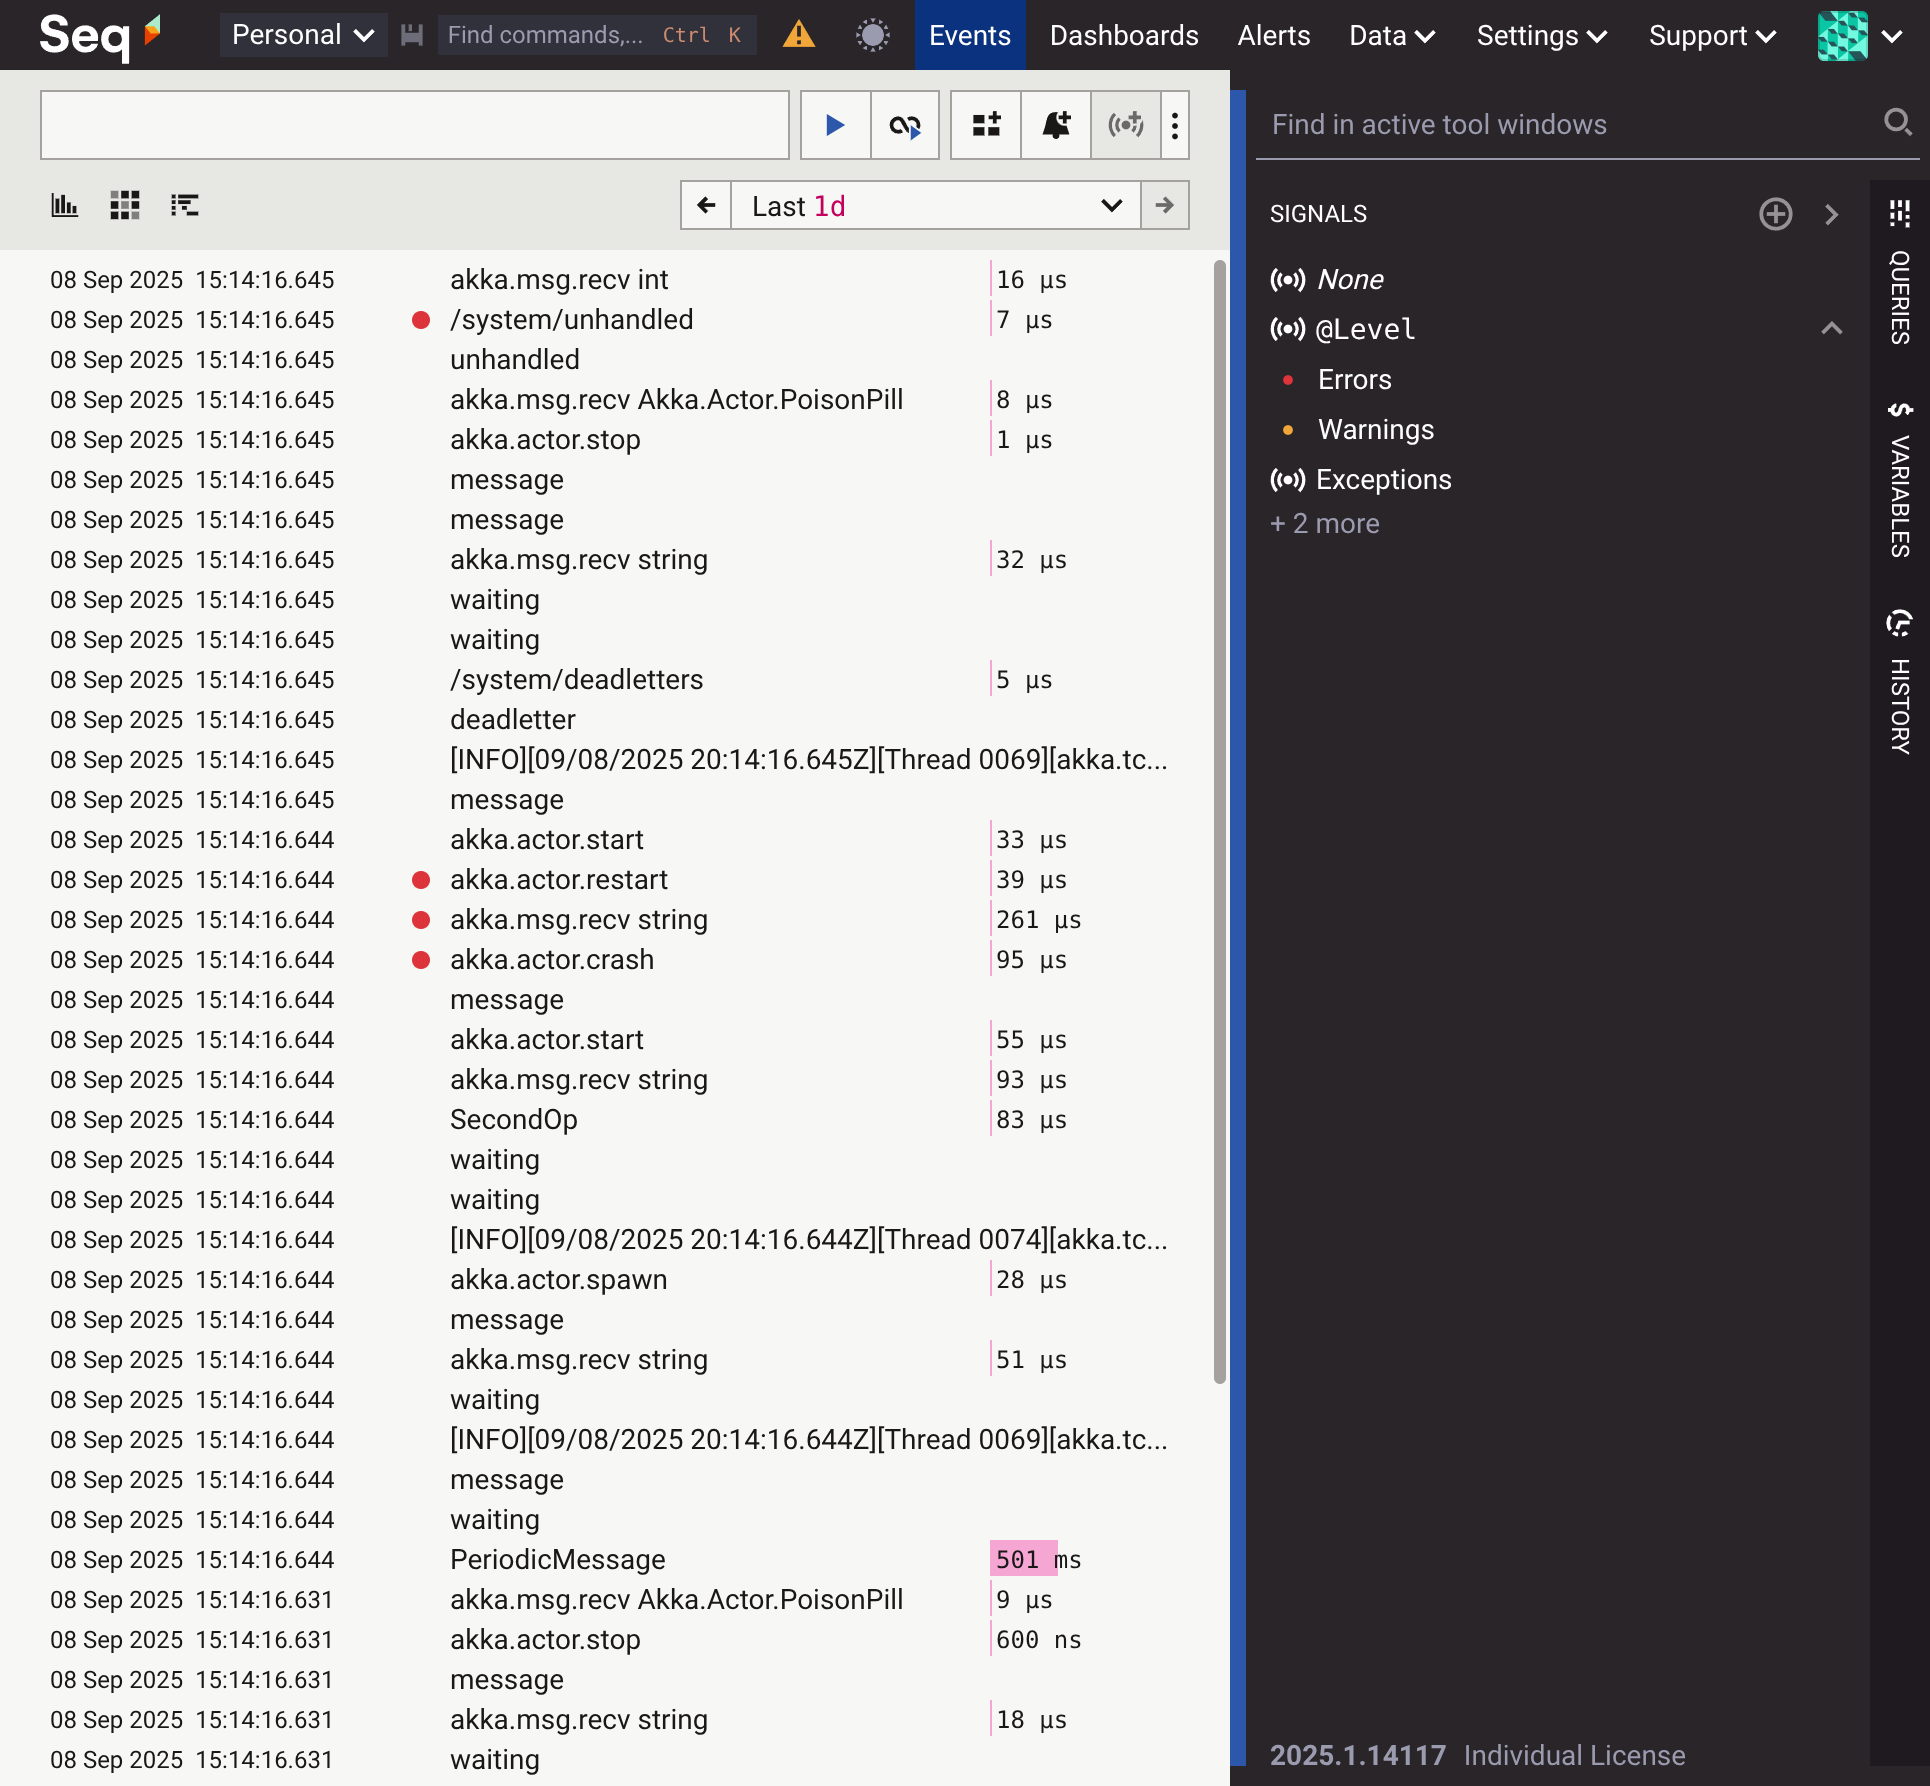
Seq Structured Logs
Powerful log querying with distributed trace correlation
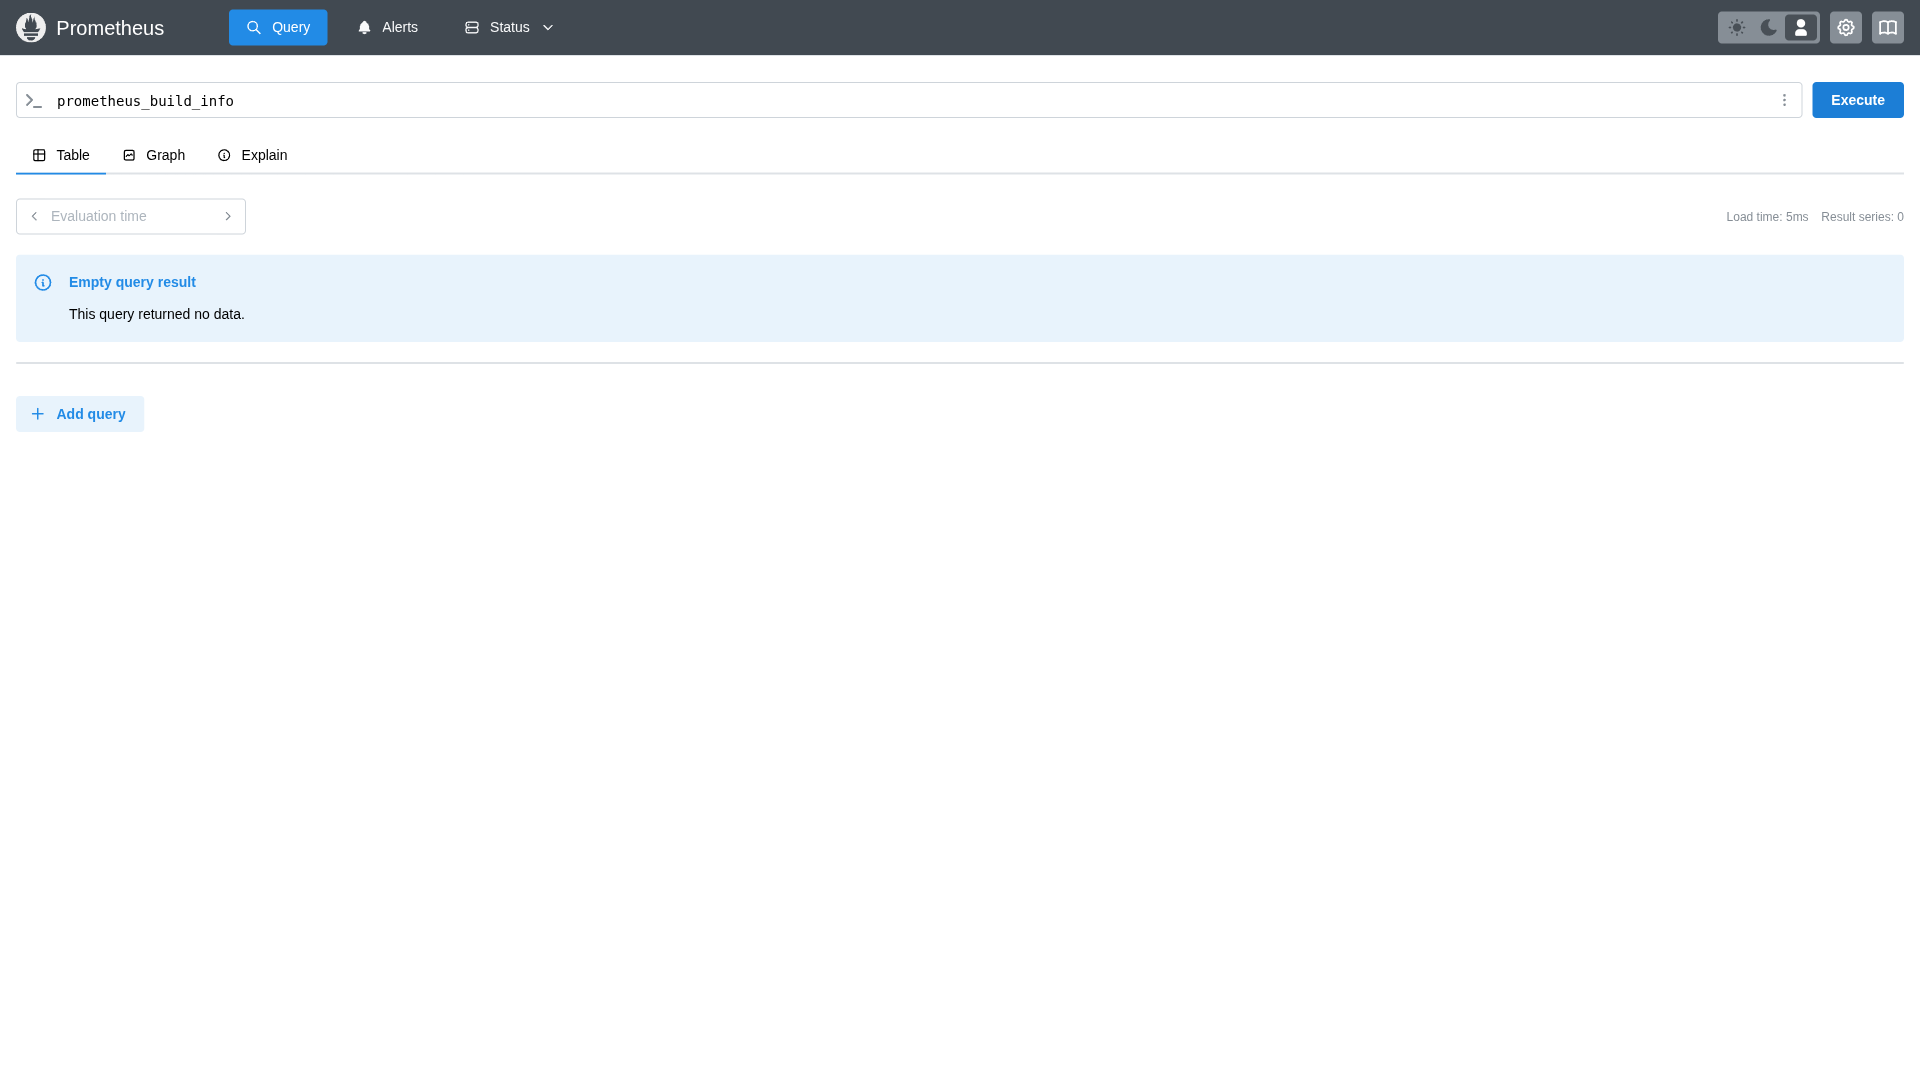
Prometheus Metrics
Raw metrics data for custom queries and alert configuration
Prerequisites
- .NET 8.0 SDK or later
- Phobos license key ($4,000/year per organization)
Step 1: Clone the QuickStart Sample
git clone https://github.com/petabridge/Petabridge.Phobos.Web.git
cd Petabridge.Phobos.Web
Step 2: Add Your Phobos License Key
Open NuGet.config and add your Phobos SDK key:
<?xml version="1.0" encoding="utf-8"?>
<configuration>
  <packageSources>
    <clear />
    <add key="nuget.org" value="https://api.nuget.org/v3/index.json" />
    <add key="phobos" value="YOUR_PHOBOS_KEY_HERE" />
  </packageSources>
</configuration>
Step 3: Run the Application
dotnet run --project src/Petabridge.Phobos.Web.Aspire/Petabridge.Phobos.Web.Aspire.csproj
That's It! 🎉
Your application is now running with full OpenTelemetry instrumentation. The QuickStart sample includes:
- Aspire Dashboard - Service orchestration and distributed traces (check console for URL)
- Grafana - Professional Akka.NET dashboards at http://localhost:3000
- Seq - Structured logs and traces at http://localhost:8988
- Prometheus - Raw metrics at http://localhost:9090
- Sample App - Generate traffic at http://localhost:1880
Important
Check out the Phobos dashboards in Grafana! We've included production-ready dashboards that Fortune 500 companies use. See our Dashboards Gallery for details on all available dashboards and how to import them into your own Grafana instance.
Adding Phobos to Your Own Application
Want to integrate Phobos into your existing Akka.NET application? Here's what the code looks like:
using Phobos.Hosting;

var builder = WebApplication.CreateBuilder(args);

// Configure OpenTelemetry logging
builder.Logging.AddOpenTelemetry(logging =>
{
    logging.IncludeFormattedMessage = true;
    logging.IncludeScopes = true;
});

// Add OpenTelemetry with Phobos
builder.Services.AddOpenTelemetry()
    .WithTracing(builder =>
    {
        builder
            .AddPhobosInstrumentation() // enables Phobos tracing
            .AddSource("YourApp.Source")
            .AddAspNetCoreInstrumentation()
            .AddHttpClientInstrumentation();
    })
    .WithMetrics(builder =>
    {
        builder
            .AddPhobosInstrumentation() // enables Phobos metrics
            .AddAspNetCoreInstrumentation()
            .AddHttpClientInstrumentation()
            .AddRuntimeInstrumentation();
    })
    .UseOtlpExporter(); // exports to any OTLP-compatible backend

// Configure Akka.NET with Phobos
builder.Services.AddAkka("ClusterSys", (builder, provider) =>
{
    builder
        .WithRemoting("localhost", 8110)
        .WithClustering()
        .WithPhobos(AkkaRunMode.AkkaCluster) // enable Phobos
        .StartActors((system, registry) =>
        {
            // Your actor initialization code here
        });
});

var app = builder.Build();
app.Run();
That's it! For detailed configuration options, see our Installation Guide and Configuration Guide.
What's Next?
- Configuration Guide - Fine-tune what gets traced
- Production Dashboards - Import our Grafana dashboards
- Performance Tuning - Optimize for high-throughput scenarios
Video Tutorial
Want a detailed walkthrough? Watch our installation video:
Troubleshooting
Can't restore NuGet packages?
- Verify your Phobos key is correctly added to NuGet.config
- Check your key is active at Sdkbin
No telemetry appearing?
- Ensure the application is generating traffic (visit http://localhost:1880)
- Check the Aspire dashboard for any errors
- Verify Prometheus is running at http://localhost:9090
Need help? Contact Petabridge Support