Phobos.Tracing.ApplicationInsights
Microsoft Application Insights is a monitoring, diagnostics, and telemetry service provided by Microsoft as part of Azure.
Phobos supports both monitoring and tracing on top of Application Insights.
NOTE
In order to use any of the Phobos integrations, you will need to first configure your akka.actor.provider setting to use one of the ActorRefProvider implementations provided by the Phobos.Actor.* NuGet packages. Click here for details.
When it comes to tracing with Application Insights, Phobos uses' Petabridge.Tracing.ApplicationInsights, Petabridge's own OpenTracing adapter built on top of Application Insights to provide correlation functionality that is consistent with what you'd expect when using Jaeger, Zipkin, or any of the other distributed tracing solutions that we support.
Phobos' Application Insights integration is available when you install the Phobos.Tracing.ApplicationInsights NuGet package from your organization's Phobos NuGet feed.
Configuring via HOCON
Phobos.Tracing.ApplicationInsights doesn't have much in the way of HOCON configuration, as most of the configuration is automated by the TelemetryClient built into Microsoft's first-party driver itself.
############################################################
# Phobos.Tracing.ApplicationInsights Reference Config File #
############################################################

phobos.tracing{
	# Will cause the Azure Application Insights driver to be loaded
	provider-type = appinsights

	appinsights{
		# The instrumentation key that identifies this AppInsights instance.
		#
		# If set to blank, Phobos.Monitoring.AppInsights will attempt to use
		# TelemetryConfiguration.Active as the source of its configuration,
		# which needs to be configured earlier in the .NET process before
		# Phobos.Monitoring attempts to load.
		#
		# Read more here: https://docs.microsoft.com/en-us/azure/application-insights/app-insights-configuration-with-applicationinsights-config
		instrumentation-key = ""

		# When set to "on", has this ActorSystem log all of its metrics
		# to AppInsights with the debug flag set to true. Should only
		# be enabled during dev and test.
		developer-mode = off
	}
}
In order to use Phobos.Tracing.ApplicationInsights you need to create an Application Insights resource inside one of your Azure resource groups and copy the Application Insights instrumentation key once it's created.
Once you have this piece of information, you can use Application Insights inside Phobos via the following HOCON configuration:
phobos.tracing{
    provider-type = appinsights
    appinsights.instrumentation-key = "YOUR KEY VALUE"
}
Test-Driving Application Insights
If you want to evaluate Phobos in combination with Application Insights, we recommend the following:
- Create an Application Insights resource on Microsoft Azure, as is described here.
- Clone our phobos-samples repository and run any of the samples in there with the Application Insights driver installed and properly configured via HOCON.
Viewing Activity Generated by Phobos.Tracing in Application Insights
One thing worth noting about Application Insights is that there is usually a 2-5 minute delay between when a trace or metric is uploaded locally and when that metric becomes visible in any of the Application Insights charts or analytics. So the first time you run your application with Phobos.Tracing.ApplicationInsights installed, please give Application Insights some time to process your data before you go looking for it in the dashboard.
However, once enough time has passed you'll find a service named after your ActorSystem sitting in the middle of the Application Map screen for Application Insights. You can click on that to drill down into individual operations recorded for this service.
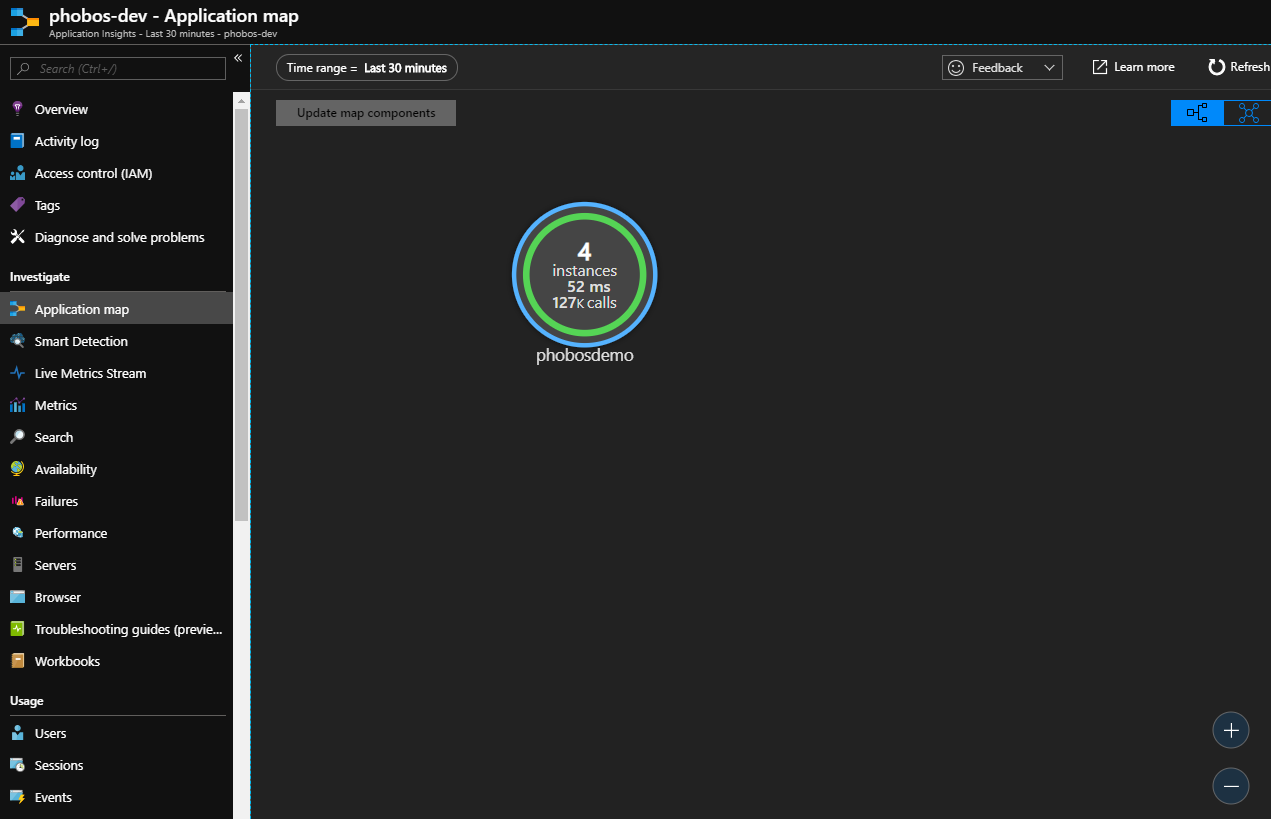
By default, all Phobos traces are recorded as server-side operations in Application Insights. So these requests will also be visible under the default Application Insights dashboard.
If you select any of the operations that are highlighted on the Application Map, you'll have an opportunity to click into specific samples of those operations. This is where you can find the detailed request-by-request traces:
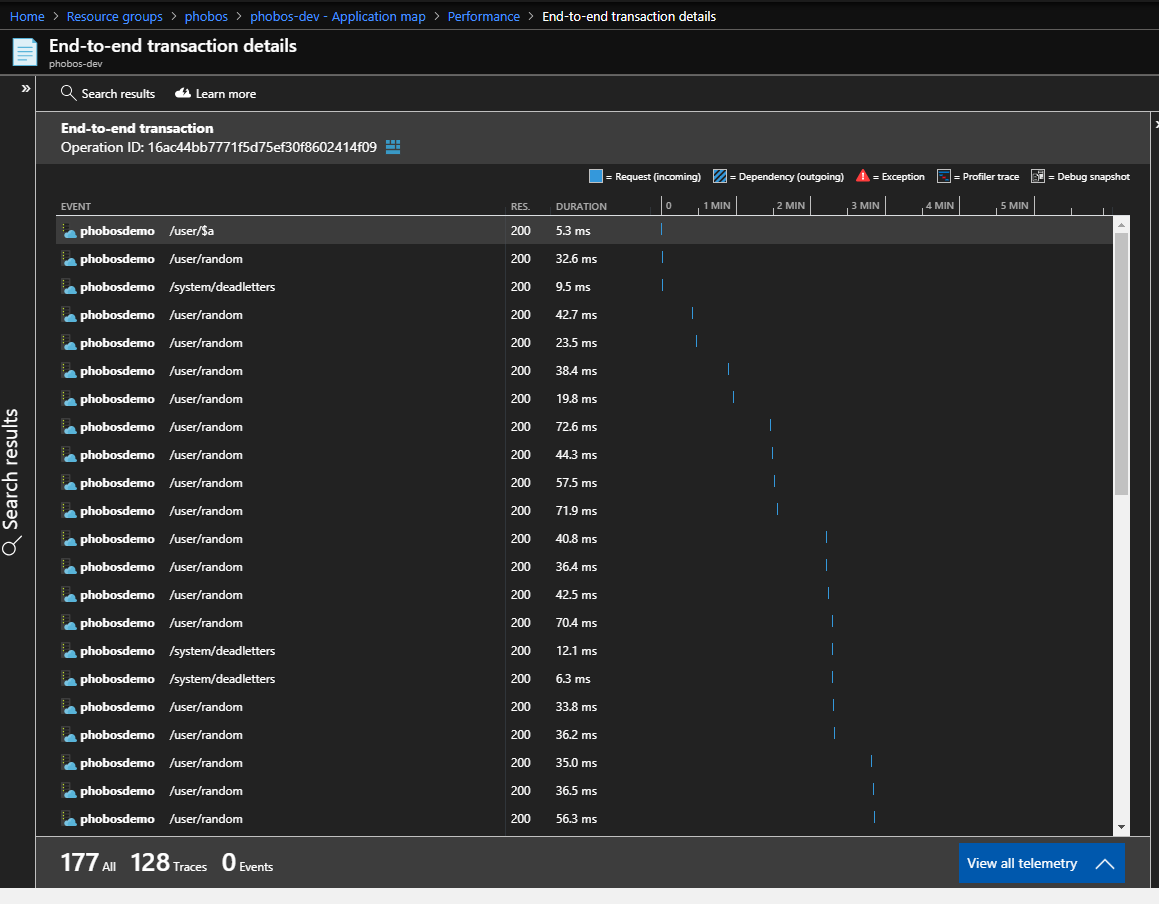
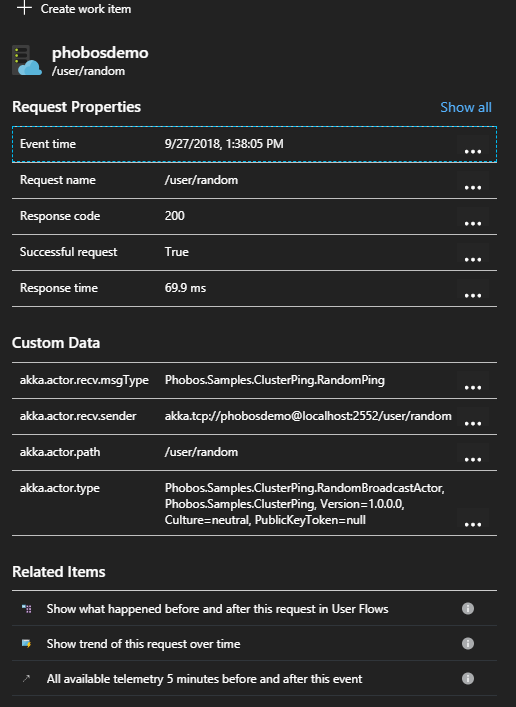
This screen will show you all of the operations that were recorded by Application Insights for this trace. Drilling down into the details for any specific operation will reveal the metadata captured by both Phobos' own APIs and Application Insights itself:
View Log Statements in Application Insights
Normally when a user calls ISpan.Log inside Phobos.Tracing, those log events are captured inline with the rest of the trace data. Unfortunately, due to how Application Insights is designed these operations are exposed separately as trace events, which you can view by clicking View All Telemetry from the Operation Details screen:
